You can get access to the spreadsheets used to make the charts in this and other posts by becoming a member of Seattle Bubble.
It was recently requested that I take a refreshed look at the affordability stats, so here’s an updated look at our affordability index charts for the counties around Puget Sound.
As of May, affordability is still not great for home buyers, but it would be much, much worse if not for the current absurdly low interest rates.
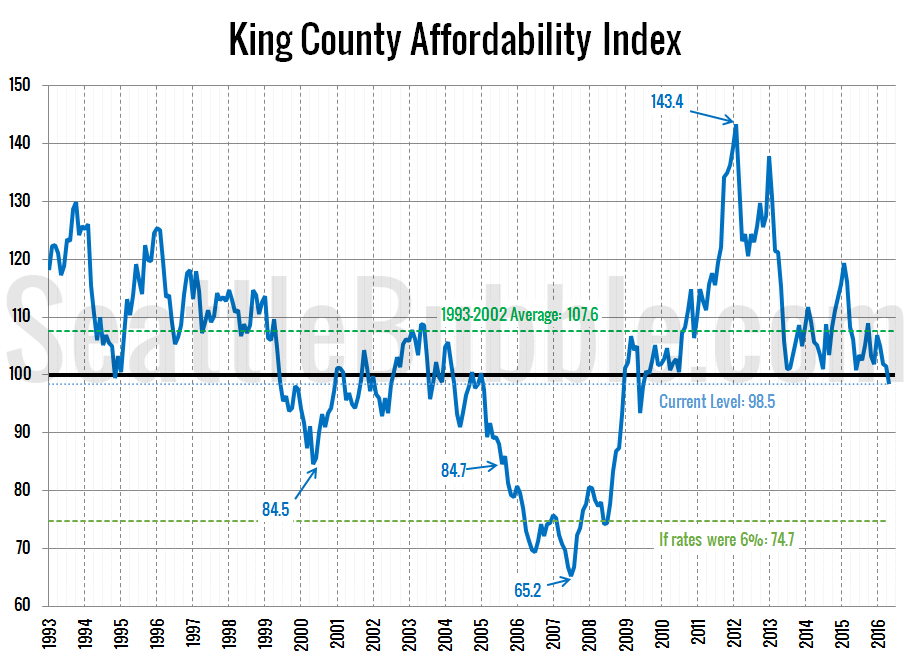
Median home prices have surged this spring (as is typical for this time of year), while interest rates are near the record-low levels they hit in late 2012. The affordability index for King County currently sits at 98.5. An index level above 100 indicates that the monthly payment on a median-priced home costs less than 30% of the median household income.
I’ve marked where affordability would be if interest rates were at a slightly more sane level of 6 percent—74.7, which is worse than any point outside of early 2006 through late 2007.
If rates went up to a more historically “normal” level of 8 percent (the average rate through the ’90s), the affordability index would be at 61.0—even lower than the level it dropped to at the peak of the previous housing bubble in 2007.
What if rates were at 6.7 percent, the same level they were at in July 2007 when the affordability index bottomed out at 65.2? At that rate with today’s home prices and incomes, the affordability index would currently be 69.4.
So basically, were it not for stupidly-low interest rates, we would be in extreme housing bubble territory right now.
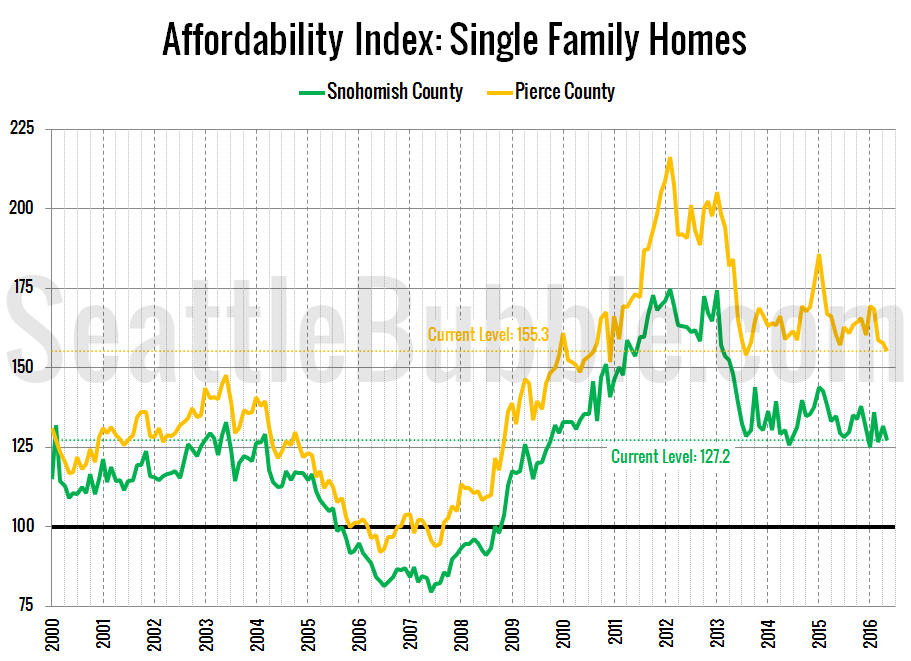
Here’s a look at the index for Snohomish County and Pierce County since 2000:
The affordability index in Snohomish currently sits at 127.2, while Pierce County is at 155.3.
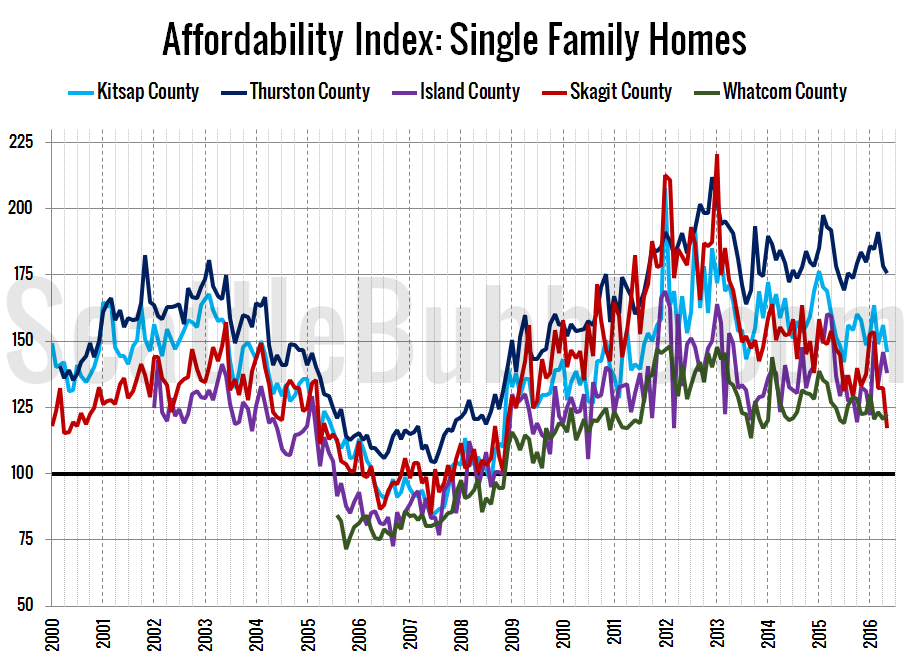
Tomorrow I will post updated versions of my charts of the “affordable” home price and income required to afford the median-priced home. Hit the jump for the affordability index methodology, as well as a bonus chart of the affordability index in the outlying Puget Sound counties.
As a reminder, the affordability index is based on three factors: median single-family home price as reported by the NWMLS, 30-year monthly mortgage rates as reported by the Federal Reserve, and estimated median household income as reported by the Washington State Office of Financial Management.
The historic standard for “affordable” housing is that monthly costs do not exceed 30% of one’s income. Therefore, the formula for the affordability index is as follows:
For a more detailed examination of what the affordability index is and what it isn’t, I invite you to read this 2009 post. Or, to calculate your the affordability of your own specific income and home price scenario, check out my Affordability Calculator.


