Get access to the full spreadsheets used to make the charts in this and other posts, as well as a variety of additional insider benefits by becoming a member of Seattle Bubble.
July market stats were published by the NWMLS yesterday. Here’s an excerpt from the NWMLS press release:
Some Brokers See Early Signs of “A More Balanced Market”
Home prices are still rising but the supply of homes is improving, prompting brokers to suggest some relief is in sight for would-be buyers. “We might actually be starting to move very slowly back toward a more balanced market,” said OB Jacobi, president of Windermere Real Estate, in commenting on July’s figures from Northwest Multiple Listing Service.
…
“We are experiencing a record breaking market,” exclaimed J. Lennox Scott, chairman and CEO of John L. Scott, Inc. “Last month was the best July in history in the Puget Sound real estate market. We’re in a frenzy hot market with a large backlog of buyers.” He credits improving inventory with spurring sales. “That additional inventory gave us the boost to not only be able to claim an all-time, best ever July, but to also position the last three months as the best in history for [pending] sales activity in the Puget Sound region.”
Slow down and take a breath, Lennox. Sheesh. Anyway, you didn’t come here to read hyperventilating home salesmen. You came here for the data, so let’s get on with the stats.
NWMLS monthly reports include an undisclosed and varying number of
sales from previous months in their pending and closed sales statistics.
Here’s your King County SFH summary, with the arrows to show whether the year-over-year direction of each indicator is favorable or unfavorable news for buyers and sellers (green = favorable, red = unfavorable):
| July 2016 | Number | MOM | YOY | Buyers | Sellers |
|---|---|---|---|---|---|
| Active Listings | 3,554 | +11.9% | +0.1% |  |
 |
| Closed Sales | 2,803 | -3.1% | -3.3% |  |
 |
| SAAS (?) | 1.33 | -1.3% | +13.1% |  |
 |
| Pending Sales | 3,198 | -4.9% | +<0.1% |  |
 |
| Months of Supply | 1.27 | +15.5% | +3.5% |  |
 |
| Median Price* | $555,000 | -3.2% | +14.4% |  |
 |
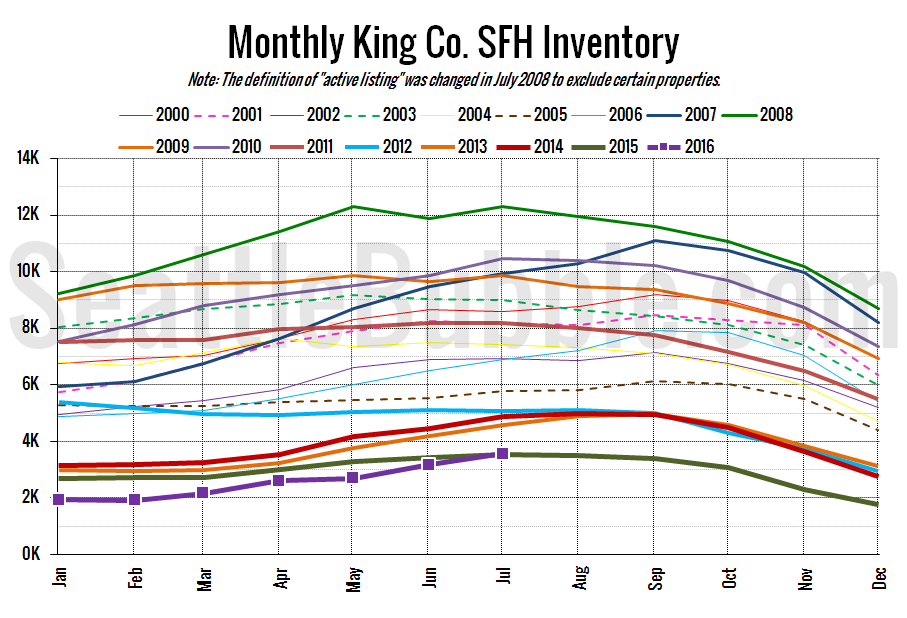
Last month I said that we might hit “positive year-over-year territory by the end of this month” and sure enough, here we are. In July, for the first time since September 2014, inventory did not set a new record low for the respective month. We still have a long way to go to get to anything remotely resembling a balanced market, but you can’t walk around the world until you take the first step.
Prices dipped slightly from June to July, and closed sales were down both month-over-month and year-over-year.
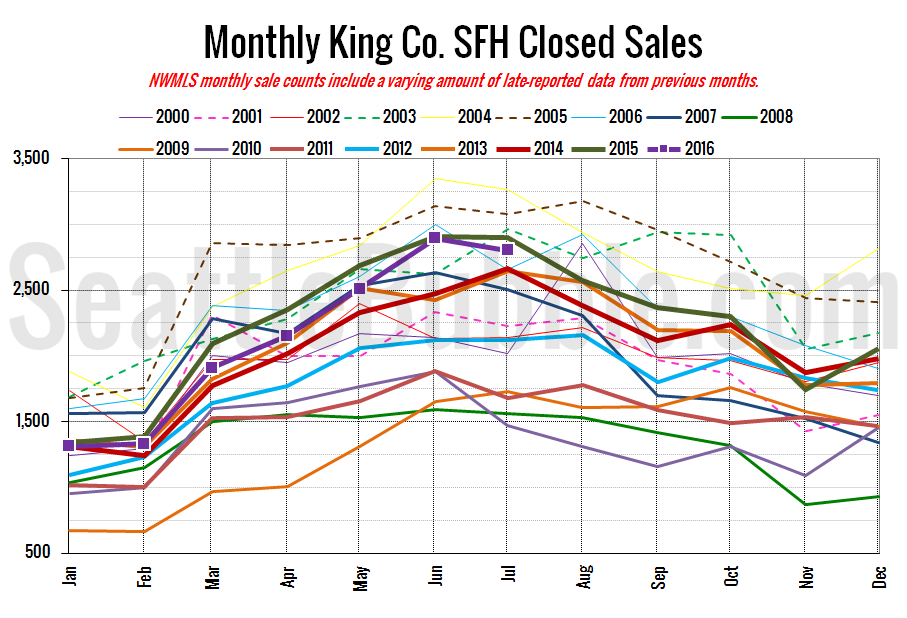
Here’s your closed sales yearly comparison chart:
Closed sales fell 3 percent from June to July, and were also down 3 percent from a year earlier.
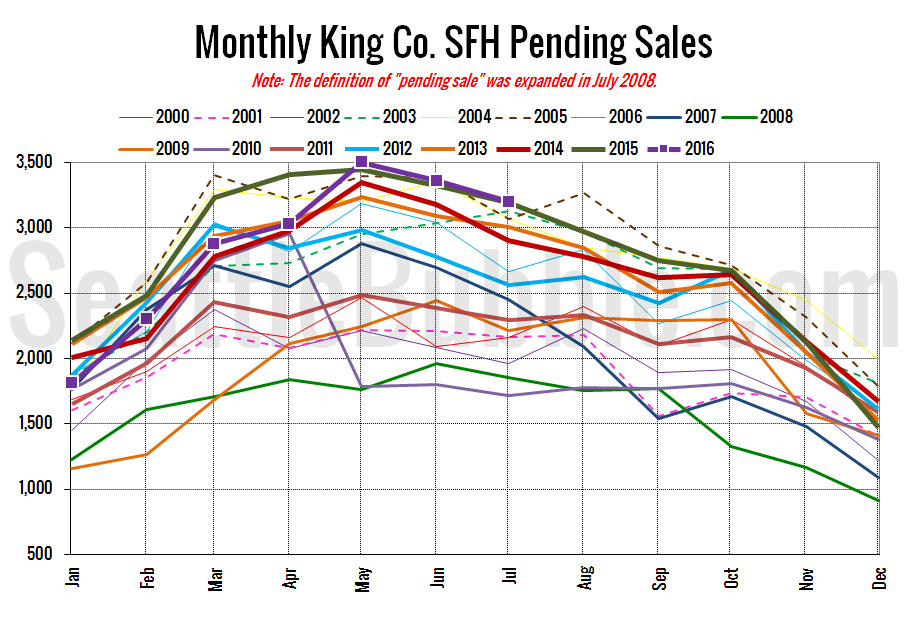
Pending sales dropped off a bit again in July (they set an all-time high in May), and were basically flat year-over-year (there was one more pending sale this July than in July 2015).
Here’s the graph of inventory with each year overlaid on the same chart.
This is the first year-over-year increase we’ve seen in inventory since August 2014.
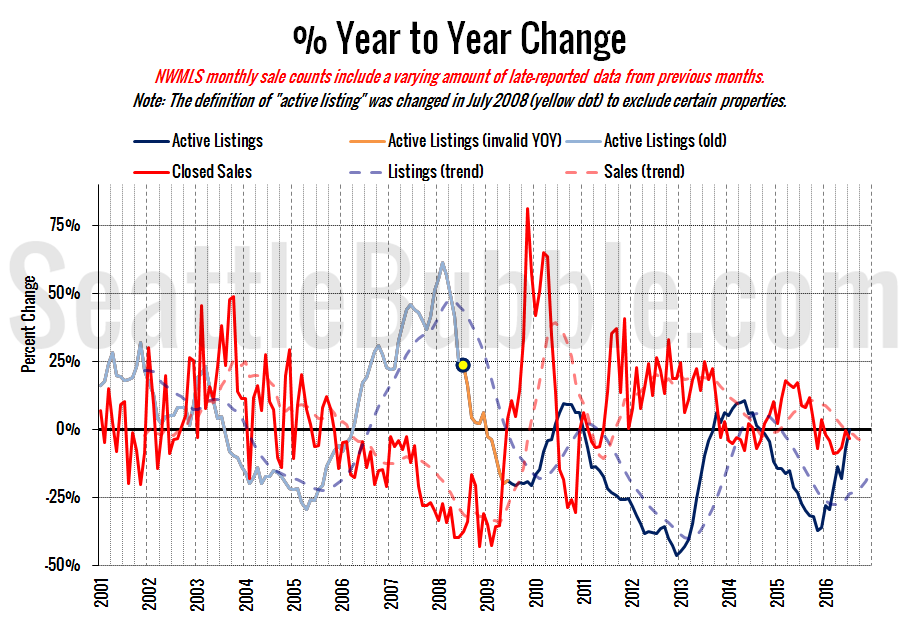
Here’s the supply/demand YOY graph. “Demand” in this chart is represented by closed sales, which have had a consistent definition throughout the decade (unlike pending sales from NWMLS).
The blue supply line crossed into positive territory finally, just barely. Meanwhile the red demand line turned back down just barely, reversing the trend of recent months.
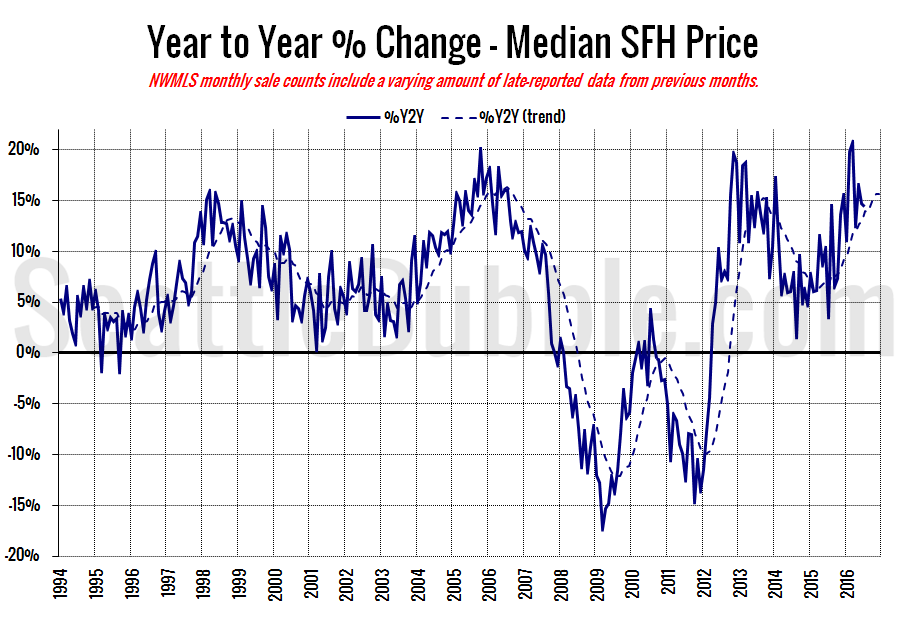
Here’s the median home price YOY change graph:
Year-over-year price growth was basically unchanged at 14 percent in July.
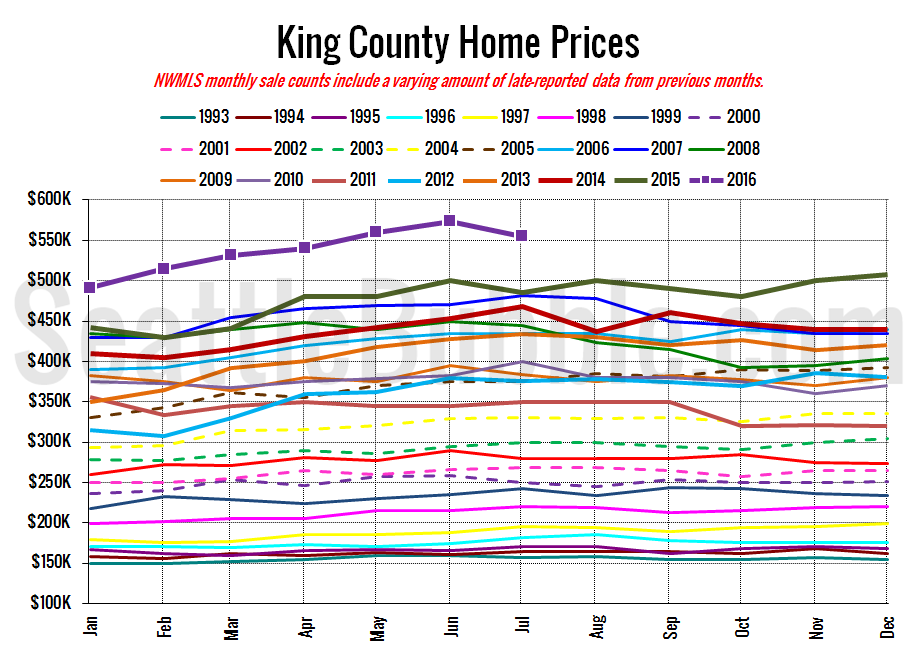
And lastly, here is the chart comparing King County SFH prices each month for every year back to 1994 (not adjusted for inflation).
July 2016: $555,000
July 2007: $481,000 (previous cycle high)
Here’s this month’s article from the Seattle Times: Owners flip new Seattle condos for big profit before they even open
Check back on Monday for the full reporting roundup.
