Get access to the full spreadsheets used to make the charts in this and other posts, as well as a variety of additional insider benefits by becoming a member of Seattle Bubble.
November market stats were published by the NWMLS this morning. Here’s their press release:
Real Estate Brokers Expect No Holiday Breather
Sales Stay Strong and Supplies Remain LowPending sales of homes hit an all-time high for the month of November according to the latest statistics from Northwest Multiple Listing Service. The report covering 23 counties around Washington state also shows the number of new listings added during the month plunged to the lowest level in 11 months, prompting MLS leaders to predict a busy winter for residential real estate as buyers compete for the smallest inventory since March.
…
“November’s pending sales for the four-county area of King, Snohomish, Pierce and Kitsap were the highest since 2005. There were 44 percent more pendings than new listings,” noted J. Lennox Scott, chairman and CEO of John L. Scott Real Estate, who described market activity as a mini power surge. “Every time interest rates increase 0.5 percent we see these surges because buyers become anxious about increasing rates – but on a historical basis rates are still amazing,” he remarked.
You can always count on Lennox. Breathless as usual.
NWMLS monthly reports include an undisclosed and varying number of
sales from previous months in their pending and closed sales statistics.
Here’s your King County SFH summary, with the arrows to show whether the year-over-year direction of each indicator is favorable or unfavorable news for buyers and sellers (green = favorable, red = unfavorable):
| November 2016 | Number | MOM | YOY | Buyers | Sellers |
|---|---|---|---|---|---|
| Active Listings | 2,309 | -23.7% | +0.3% |  |
 |
| Closed Sales | 2,249 | -10.5% | +29.2% |  |
 |
| SAAS (?) | 0.81 | -10.5% | -16.0% |  |
 |
| Pending Sales | 2,224 | -21.4% | +4.8% |  |
 |
| Months of Supply | 1.03 | -14.7% | -22.4% |  |
 |
| Median Price* | $550,000 | 0.0% | +10.0% |  |
 |
Pretty much all the stats moved against buyers in November. Inventory was just barely above last year’s level, but closed sales were considerably higher than a year ago. The nearly thirty percent surge in closed sales compared to a year earlier was the largest year-over-year move we’ve seen since October 2012. It is also a little strange, considering that pending sales haven’t increased more than eight percent any time in the past twelve months. I’ll be looking into that in the coming days to try to understand what’s going on there.
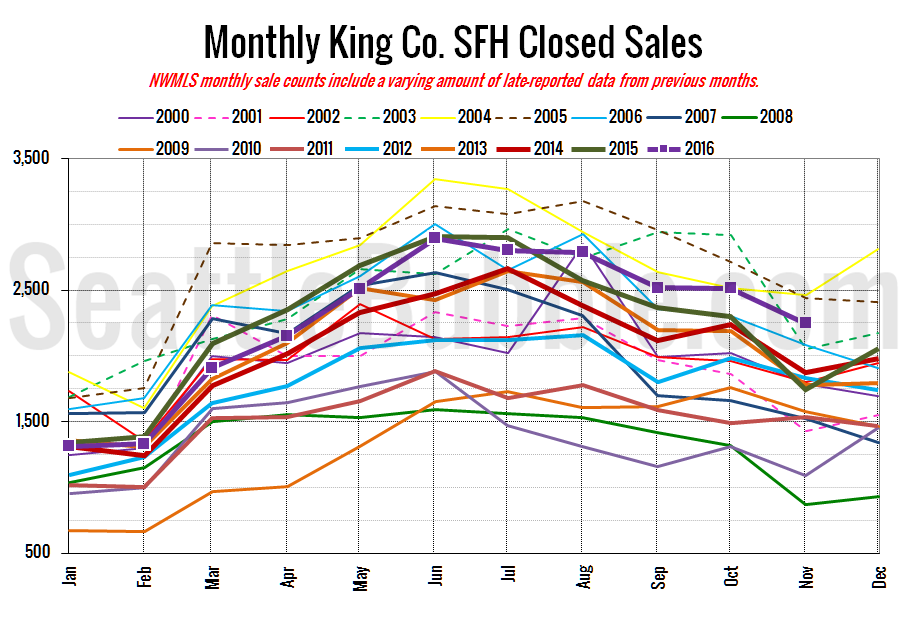
Here’s your closed sales yearly comparison chart:
Closed sales fell slightly from October to November, but were up dramatically from a year ago, as mentioned earlier.
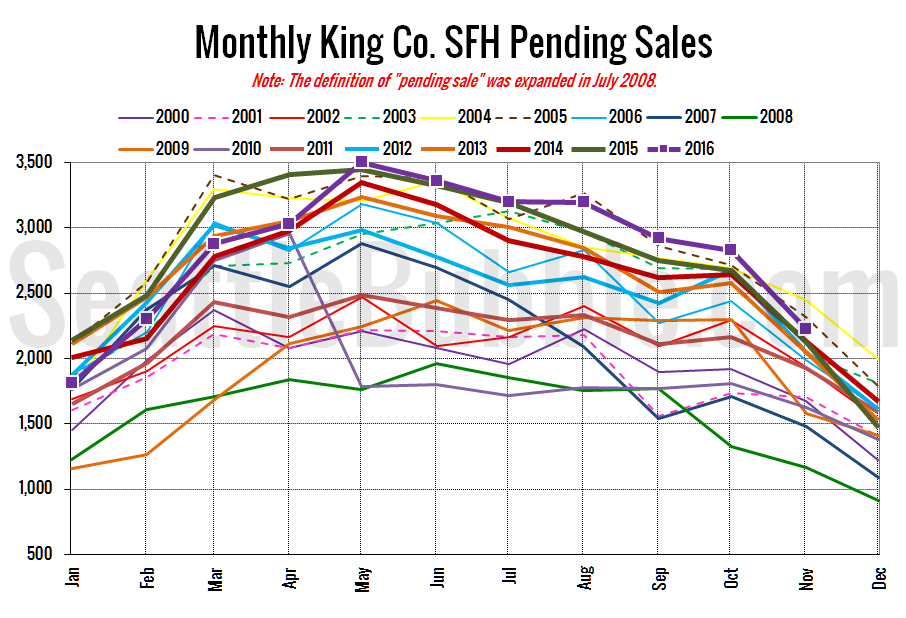
Pending sales fell twenty-one percent in November, but were still up five percent year-over-year.
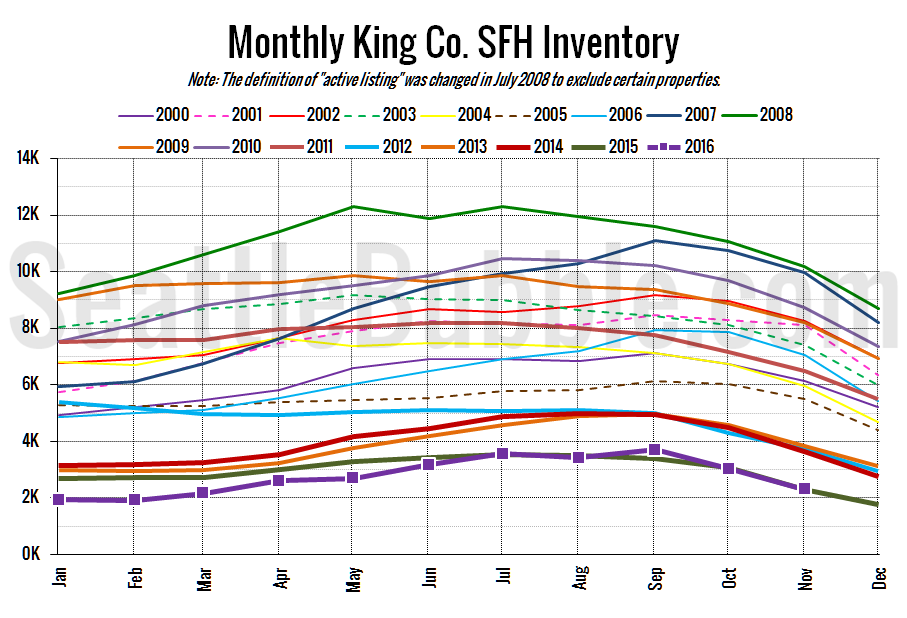
Here’s the graph of inventory with each year overlaid on the same chart.
Listings followed pretty much exactly the same path as last year, ending up the month just slightly above the same level as November 2015.
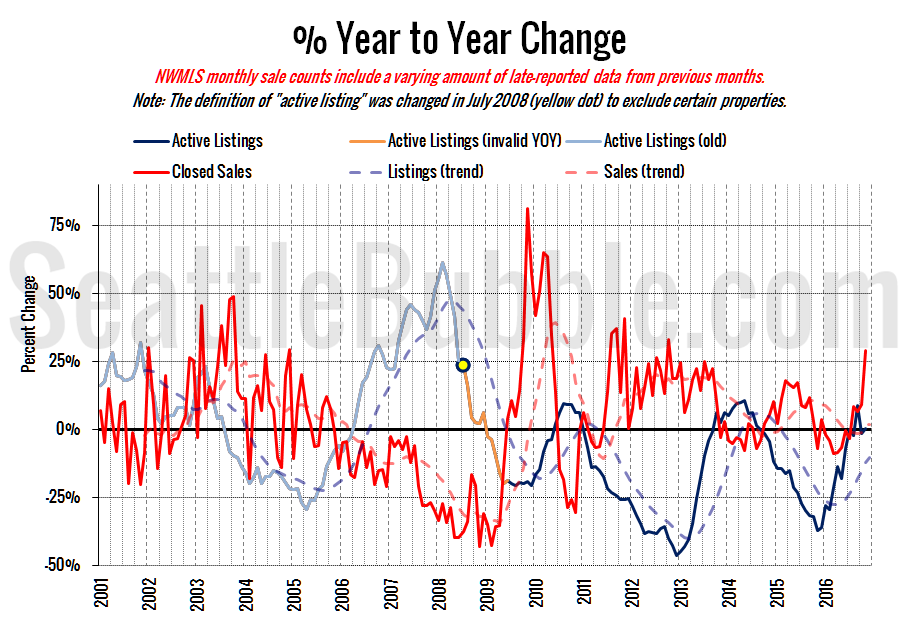
Here’s the supply/demand YOY graph. “Demand” in this chart is represented by closed sales, which have had a consistent definition throughout the decade (unlike pending sales from NWMLS).
November saw the strongest move into seller’s market territory that we’ve seen in a long time for demand.
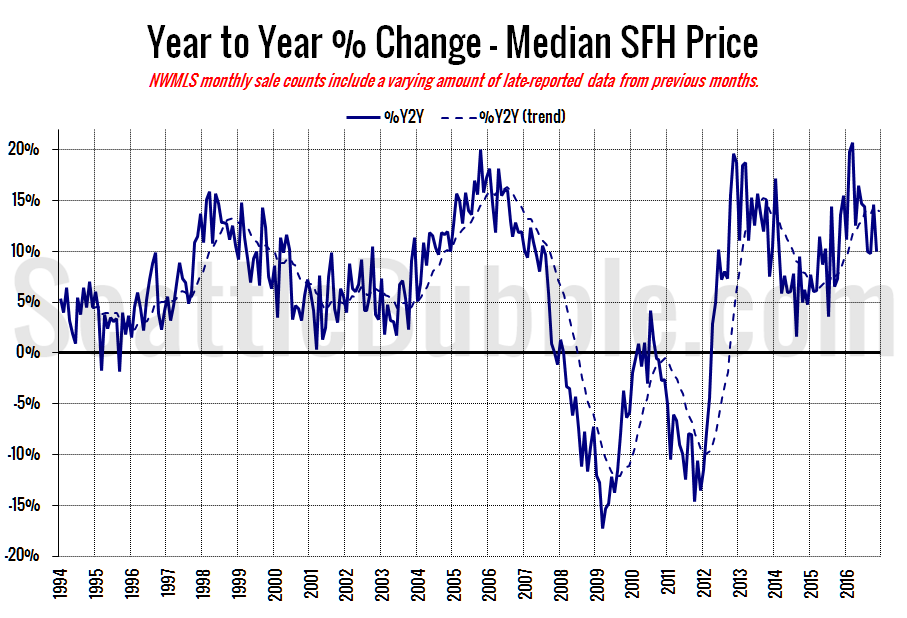
Here’s the median home price YOY change graph:
Year-over-year home price gains fell from nearly fifteen percent in October back to ten percent in November
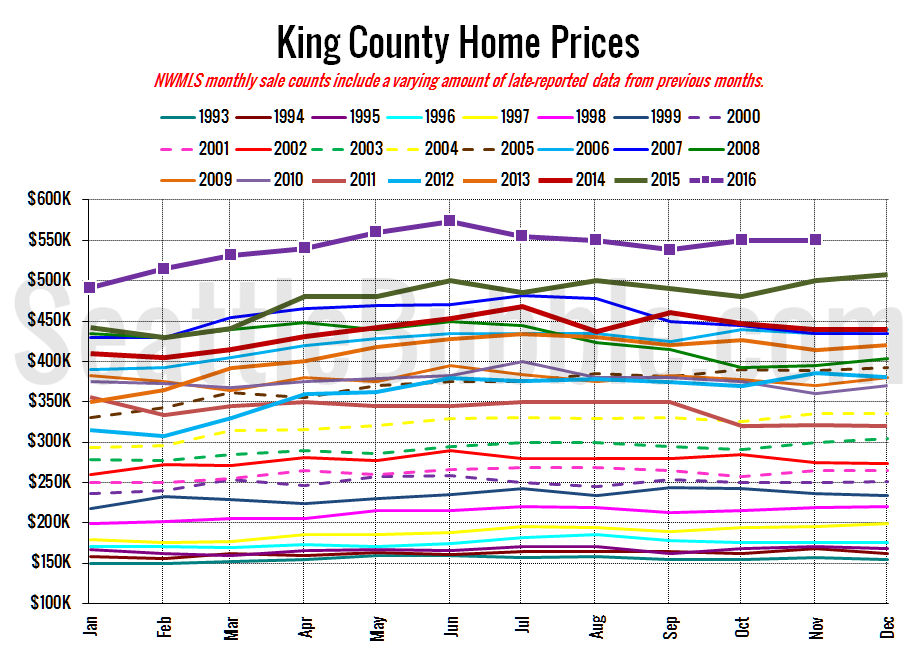
And lastly, here is the chart comparing King County SFH prices each month for every year back to 1994 (not adjusted for inflation).
October 2016: $550,000
July 2007: $481,000 (previous cycle high)
Here’s the article from the Seattle Times: ‘Panicking’ Seattle home buyers, spooked by rising interest rates, rush to buy
If this “interest rate panic” story sounds familiar, it’s because we’ve heard it a few times before.
