Get access to the full spreadsheets used to make the charts in this and other posts, as well as a variety of additional insider benefits by becoming a member of Seattle Bubble.
August market stats have been published by the NWMLS. Here’s a quick excerpt from their press release:
“For August, we experienced a more robust market than anticipated,” remarked Diedre Hanes, principal managing broker-South Snohomish County at Coldwell Banker Bain in Lynnwood. “Compared to years past, we’ve seen very limited slowdown,” she added.
…
“Nobody likes this market, – not sellers, not buyers, not real estate brokers,” proclaimed Northwest MLS director Dick Beeson. The reasons vary, he explained. “Sellers aren’t necessarily happy because they think they could be leaving money on the table. Buyers think they’re paying too much. And brokers think sales are more complex and fraught with peril than previously, making them harder to close.”Beeson, the principal managing broker at RE/MAX Professionals in Gig Harbor, believes Seattle and surrounding areas are “forever changed” by this market. “The change isn’t going to be painless. Housing scarcity and increasing prices are sore spots.” Whether price increases will subside is anyone’s guess, he added.
Prices aren’t the only worry, suggested Haines. She said low appraisals occur on about one of every three sales. “The low appraisal number remains consistent at $25,000-to-$30,000 below sales price when it occurs. It makes one wonder why – coincidence or something else?” she stated.
Haines noted multiple offers are continuing, but added a note of caution to sellers: “Overpriced listings are not getting showings or offers. Buyers are well educated and well informed, which definitely eases fears of a developing bubble.”
“Everyone who is buying right now is so smart! What a great decision to buy a home in this market, no matter the price!” As if a home salesman is going to come out in a press release and suggest that buyers are ignorant and making stupid decisions. I’m not saying that’s the case for buyers today, but if it were, would agents ever say it? Of course not.
Now let’s dive into the numbers for August.
NWMLS monthly reports include an undisclosed and varying number of
sales from previous months in their pending and closed sales statistics.
Here’s your King County SFH summary, with the arrows to show whether the year-over-year direction of each indicator is favorable or unfavorable news for buyers and sellers (green = favorable, red = unfavorable):
| August 2017 | Number | MOM | YOY | Buyers | Sellers |
|---|---|---|---|---|---|
| Active Listings | 2,820 | -2.7% | -17.5% |  |
 |
| Closed Sales | 2,797 | +2.6% | +0.3% |  |
 |
| SAAS (?) | 1.20 | -5.7% | -0.2% |  |
 |
| Pending Sales | 3,073 | +4.2% | -3.8% |  |
 |
| Months of Supply | 1.01 | -5.1% | -17.7% |  |
 |
| Median Price* | $650,000 | -1.2% | +18.2% |  |
 |
Every month I hope to see some good news for buyers in the numbers. Every month I am disappointed. Listings are still in short supply, sales are strong, and prices just keep going up at a breakneck pace. Sorry, buyers.
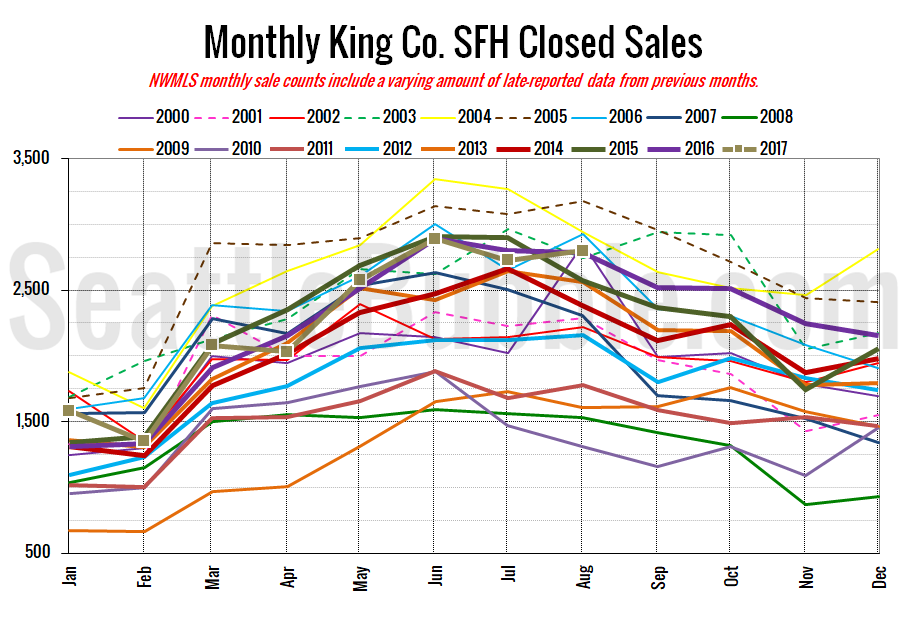
Here’s your closed sales yearly comparison chart:
Closed sales increased three percent between July and August. Last year over the same period closed sales decreased half a percent. Year-over-year closed sales were up less than a percent.
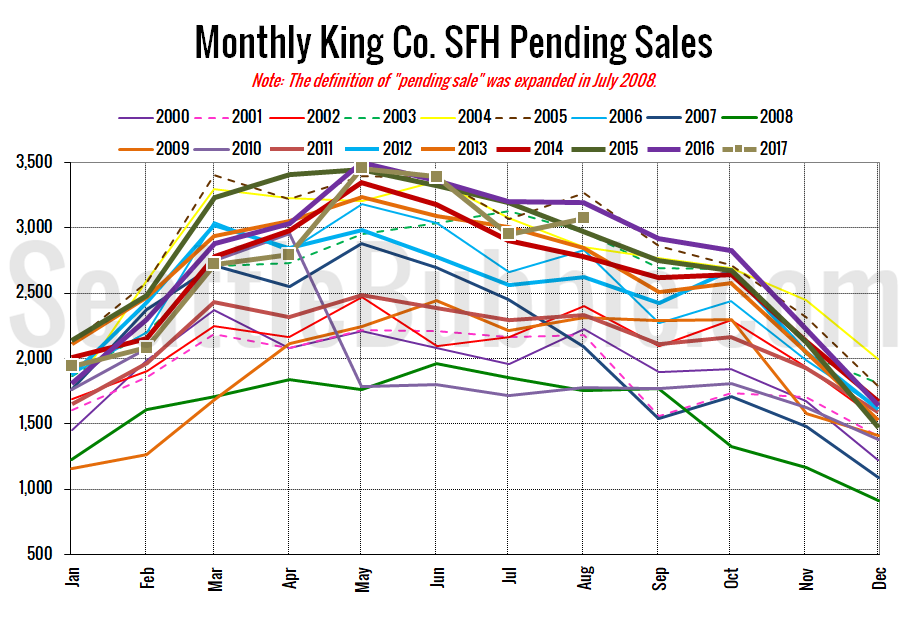
Pending sales rose four percent from July to AUgust, and were down four percent year-over-year.
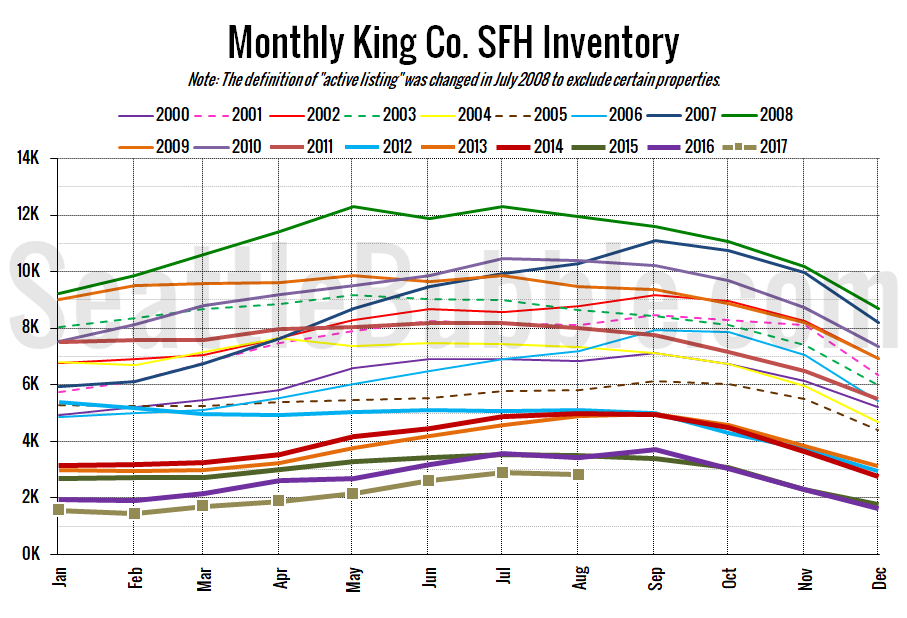
Here’s the graph of inventory with each year overlaid on the same chart.
Inventory fell three percent from July to August, and was down seventeen percent from a year earlier.
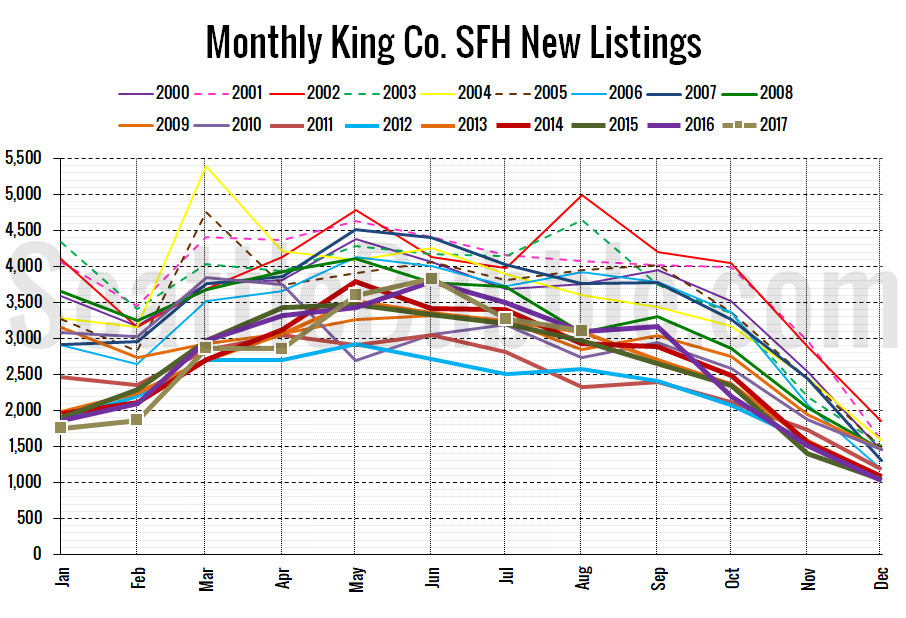
Here’s the chart of new listings:
New listings were down five percent month-over-month, and up just slightly from last year.
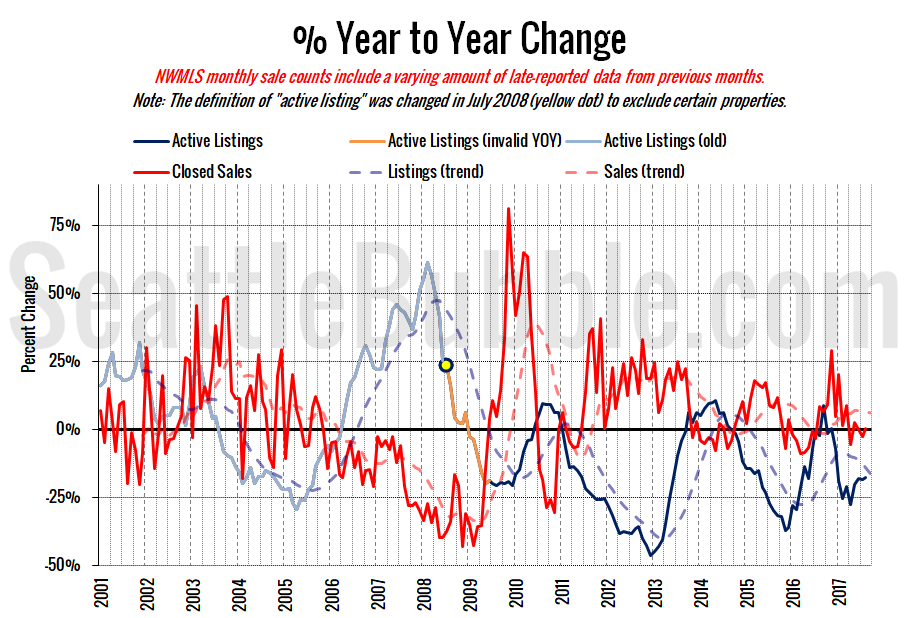
Here’s the supply/demand YOY graph. “Demand” in this chart is represented by closed sales, which have had a consistent definition throughout the decade (unlike pending sales from NWMLS).
Still the same story we’ve seen for a while. Great time to be a seller, terrible time to be a buyer.
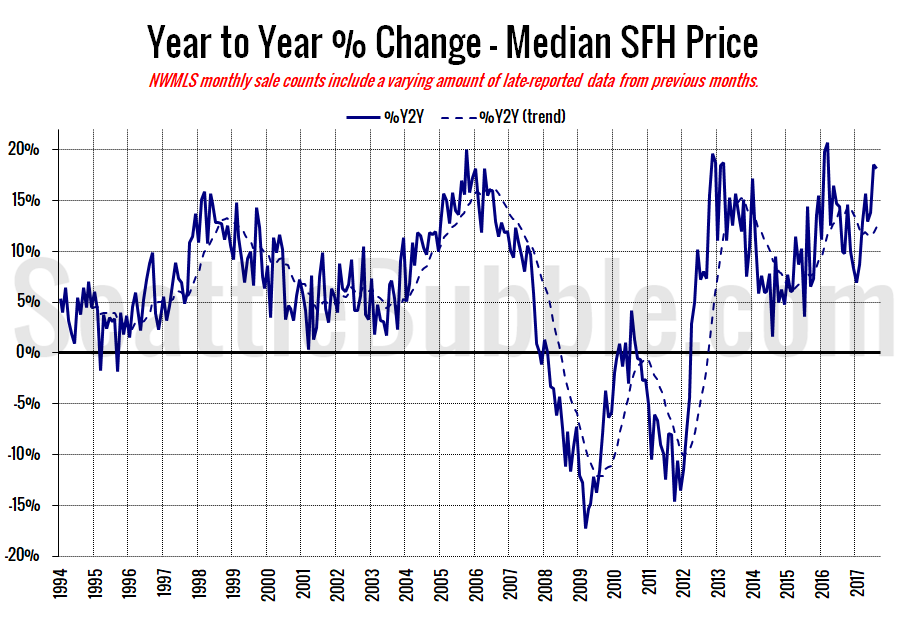
Here’s the median home price YOY change graph:
Year-over-year price changes slowed just barely between July and August but still sit at a very high level.
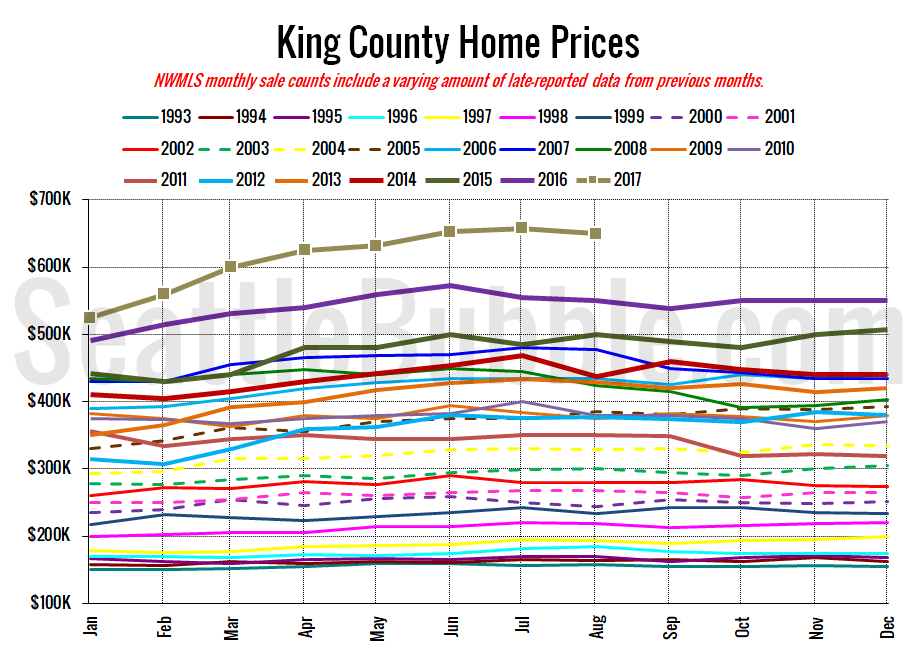
And lastly, here is the chart comparing King County SFH prices each month for every year back to 1994 (not adjusted for inflation).
Down slightly from July, but very close to the all-time high.
August 2017: $650,000
July 2007: $481,000 (previous cycle high)
Here’s the article from the Seattle Times: King County home prices surge 18 percent, most on record for this time of year
