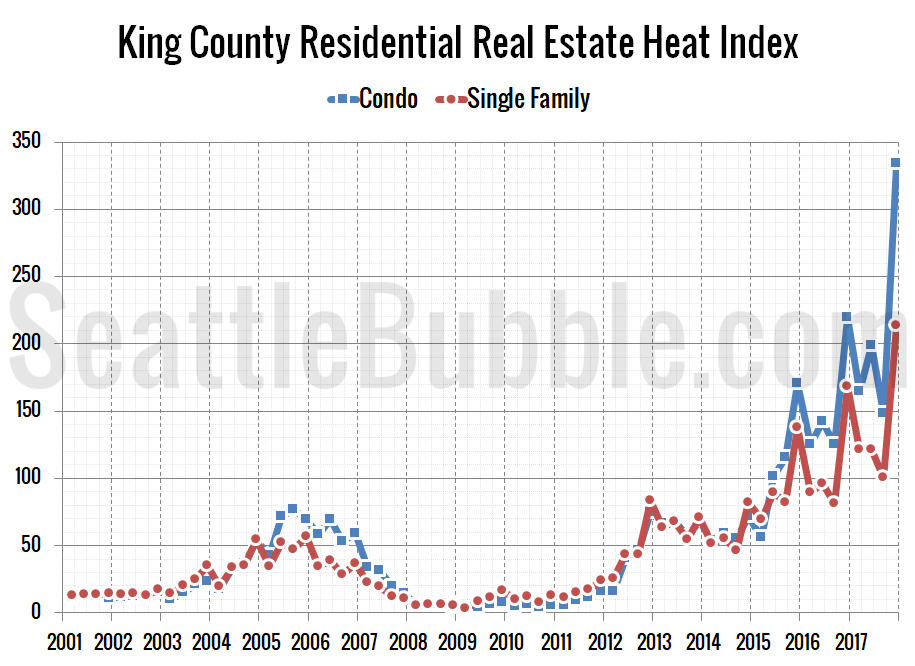
After the final 2017 Seattle-area real estate sales data was released last week by the NWMLS, I updated my chart of the “Residential Real Estate Heat Index” for King County single-family homes and condos.
As a reminder, the “Residential Real Estate Heat Index” is an index that rolls changes in the median price, new listings, total inventory, pending sales and closed sales all into a single number to measure the relative “heat” of the market. Note that this index only looks at the real estate sales market. It does not factor in any other economic conditions such as wages, interest rates, rents, etc.
Below is the latest data for the heat index of King County single-family homes and condos. It has been quite a while since I last updated this chart, and… holy cow.
At 213.9, the latest King County heat index dwarfs the average level seen during the last bubble (42.6). Keeping with the trend we saw during the previous bubble, the condo heat index is even more out of control, coming in at 334.3 in the fourth quarter (more than five times the 61.4 average during the last bubble).
Based on this measure, we have been well into bubble territory since late 2015, and things have gotten seriously out of control since then.
However, as I mentioned earlier, this index doesn’t account for external economic factors at all. The current situation is definitely very different from last time, and we need to look at a more complete picture before we can definitely say this is a new bubble. I’ll be updating some of those broader charts later this month.
Still though… damn.
