Seattle Bubble spreadsheets are updated even when content isn’t frequently posted. You can get access to the spreadsheets by becoming a member of Seattle Bubble.
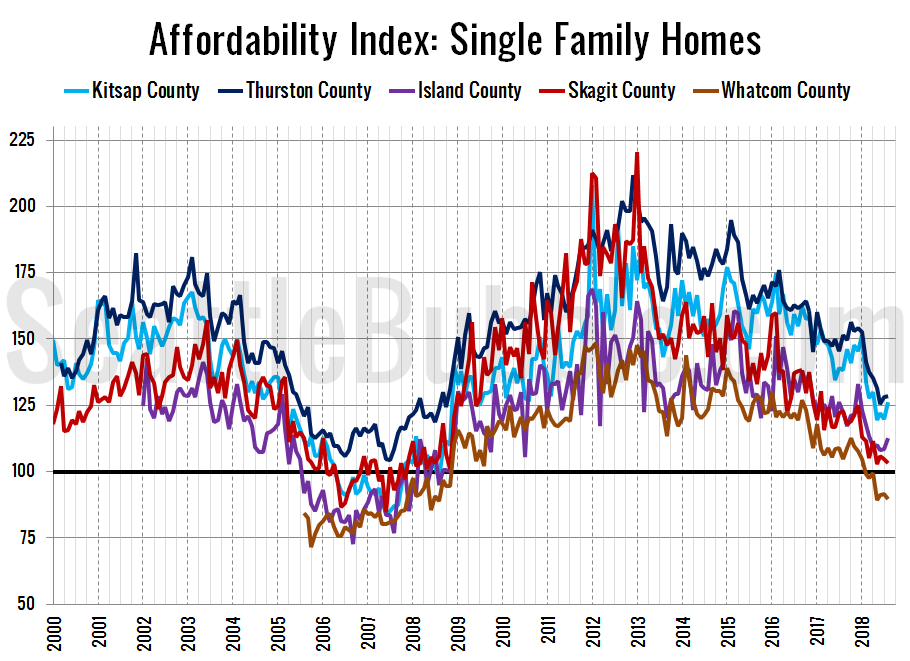
By popular request, let’s take a look at our affordability index charts for the counties around Puget Sound.
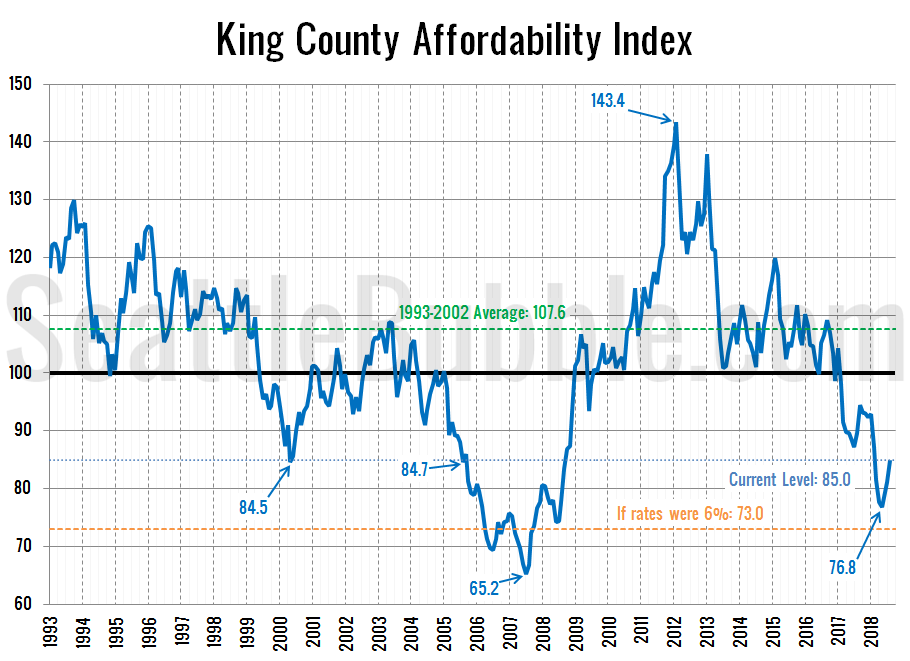
As of August, the affordability index has bounced up slightly from its May low (which was the lowest point since nearly a decade ago in July 2008), but still sits at the very low level of 85.0.
For context, eighty-six percent of the 306 months on record back through 1993 have had a higher affordability index than what we had in August 2018.
An index level above 100 indicates that the monthly payment on a median-priced home costs less than 30% of the median household income.
I’ve marked where affordability would be if interest rates were at a slightly more sane level of 6 percent—73.0, which is worse than any point outside of the peak bubble years of 2006 and 2007.
If rates went up to a more historically “normal” level of 8 percent (the average rate through the ’90s), the affordability index would be at 59.1—six points below the record low level that was set in July 2007.
The entirety of the bump in the affordability index over the last few months is due to slipping home prices, which peaked in May at $726,275 and have since fallen $57,275 to $669,000. I suspect that the near-record-low levels of affordability may be a big factor in why sales have slowed (and thus inventory has increased) this year.
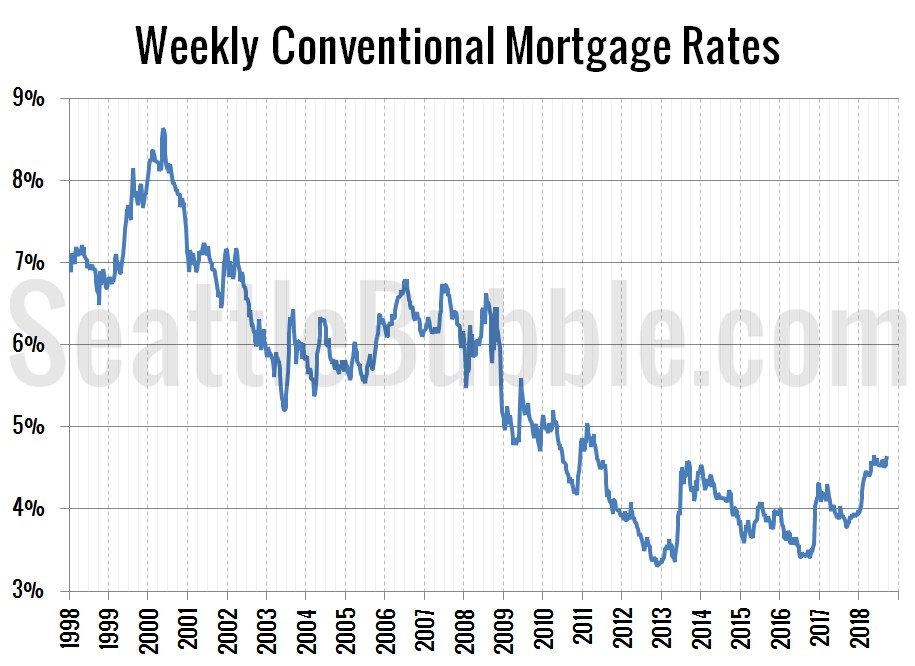
Meanwhile, while mortgage interest rates did climb late last year and early this year, they have been relatively stable over the last few months.
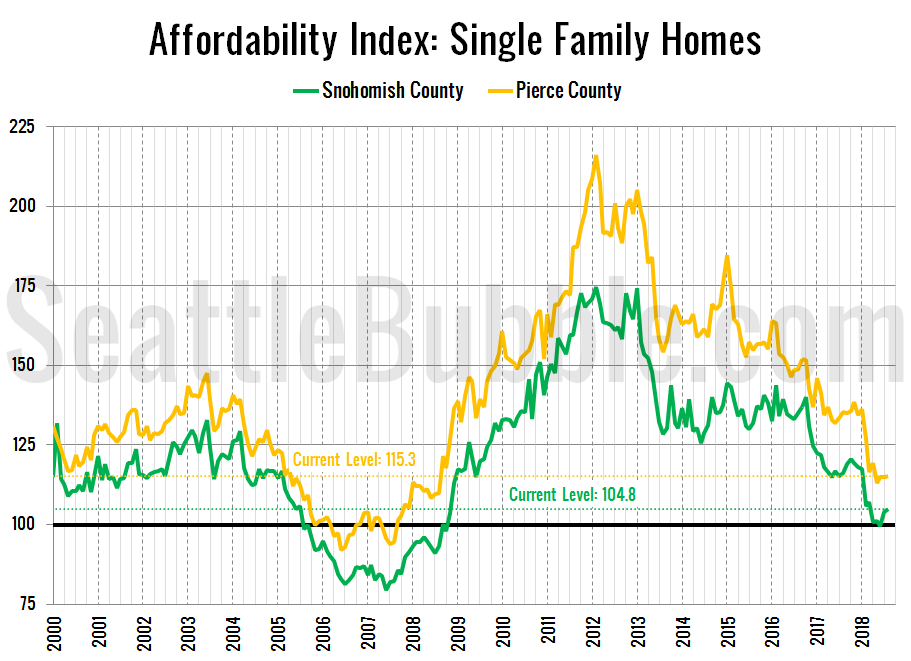
Here’s a look at the index for Snohomish County and Pierce County since 2000:
The affordability index in Snohomish currently sits at 104.8, while Pierce County is at 115.3. Both down considerably over the last few years, and at levels comparable to late 2008.
You can calculate whether a home purchase scenario is “affordable” using the Affordability Index measure with my simple affordability calculator.
Tomorrow I will post updated versions of my charts of the “affordable” home price and income required to afford the median-priced home. Hit the jump for the affordability index methodology, as well as a bonus chart of the affordability index in the outlying Puget Sound counties.
As a reminder, the affordability index is based on three factors: median single-family home price as reported by the NWMLS, 30-year monthly mortgage rates as reported by the Federal Reserve, and estimated median household income as reported by the Washington State Office of Financial Management.
The historic standard for “affordable” housing is that monthly costs do not exceed 30% of one’s income. Therefore, the formula for the affordability index is as follows:
For a more detailed examination of what the affordability index is and what it isn’t, I invite you to read this 2009 post. Or, to calculate your the affordability of your own specific income and home price scenario, check out my Affordability Calculator.


