Get access to the full spreadsheets used to make the charts in this and other posts, as well as a variety of additional insider benefits by becoming a member of Seattle Bubble.
September market stats were published by the NWMLS today. Home prices have leveled off as sales continue to slip and inventory piles up. Year-over-year listing growth hit its highest level ever as the number of homes on the market reached its highest level since January 2012.
Before we get into our detailed monthly stats, here’s a quick look at their press release.
Balance “finally returning” to housing market as buyers welcome more choices, moderating prices
Housing inventory continued to improve during September while the pace of sales slowed in many counties served by Northwest Multiple Listing Service. “Balance is finally returning to the market, and with it, slowing home price growth,” stated OB Jacobi, president of Windermere Real Estate.
…
J. Lennox Scott, chairman and CEO of John L. Scott Real Estate, encouraged would-be buyers to “put extra focus on October,” which he described as the last great month for new listings until March 2019. “Over the winter, new monthly resale listings will lower by approximately 50 percent compared to summer months.” He also noted interest rates, currently in the upper 4 percent, are projected to rise in the coming months.
…
Despite slower sales, Northwest MLS spokespeople remain upbeat.“The housing market close to the job centers has gone from a historic extreme-frenzy market in the spring down a few levels of hotness to a strong level of pending sales activity for new listings,” said Scott.
When is J. Lennox Scott ever not “upbeat” about the prospects for the housing market?
Trick question! The answer is never!
NWMLS monthly reports include an undisclosed and varying number of
sales from previous months in their pending and closed sales statistics.
Here’s your King County SFH summary, with the arrows to show whether the year-over-year direction of each indicator is favorable or unfavorable news for buyers and sellers (green = favorable, red = unfavorable):
| September 2018 | Number | MOM | YOY | Buyers | Sellers |
|---|---|---|---|---|---|
| Active Listings | 5,213 | +11.7% | +67.9% |  |
 |
| Closed Sales | 1,833 | -23.1% | -27.0% |  |
 |
| SAAS (?) | 1.73 | +20.5% | +47.9% |  |
 |
| Pending Sales | 2,244 | -7.7% | -18.0% |  |
 |
| Months of Supply | 2.84 | +45.3% | +130.2% |  |
 |
| Median Price* | $668,000 | -0.1% | +6.9% |  |
 |
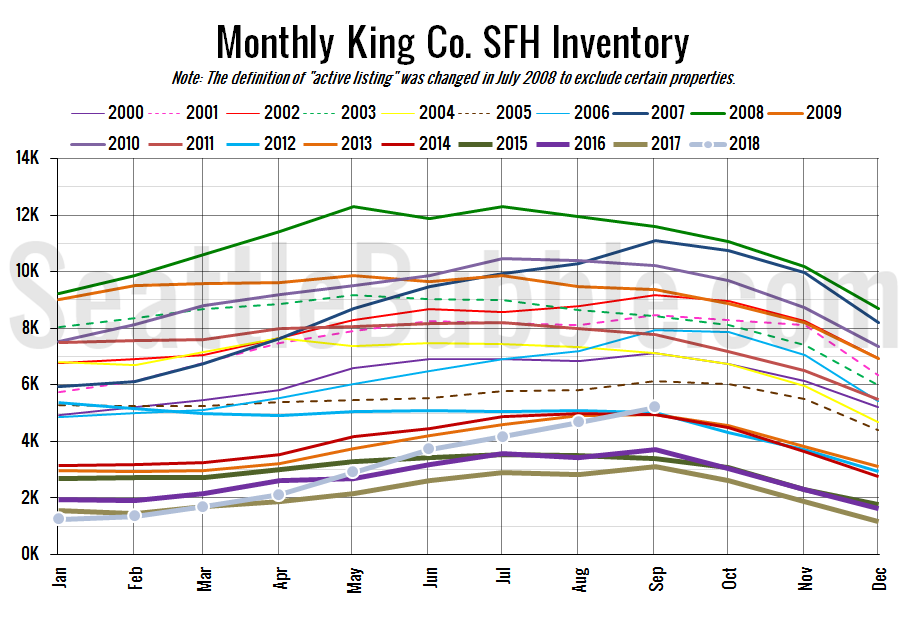
Here’s the graph of inventory with each year overlaid on the same chart.
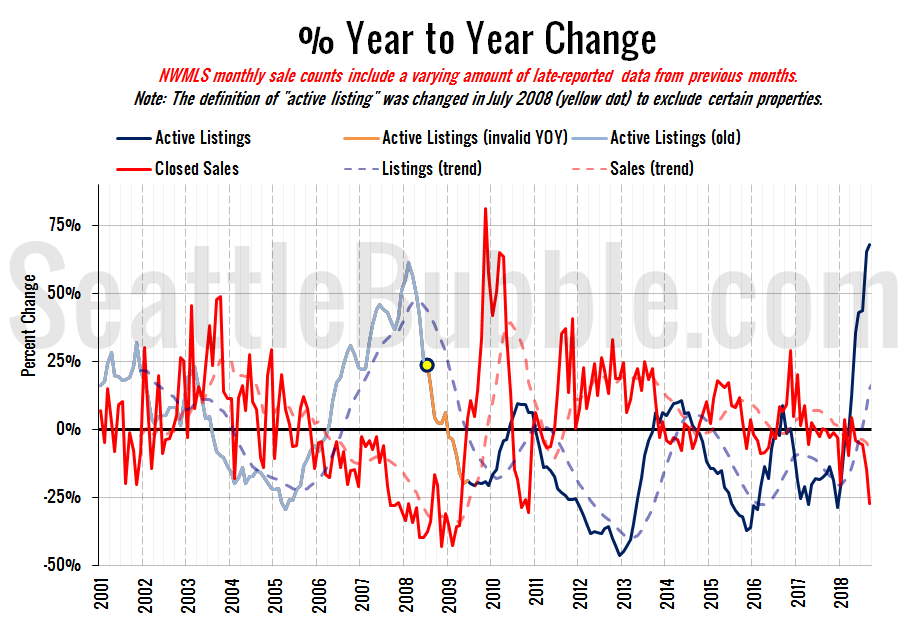
Inventory rose twelve percent from August to September, and was up 67.9 percent from last year. Before this year, the highest year-over-year inventory gain was 61.3 percent way back in February 2008. The last time there were over 5,000 homes on the market at the end of September was in 2012.
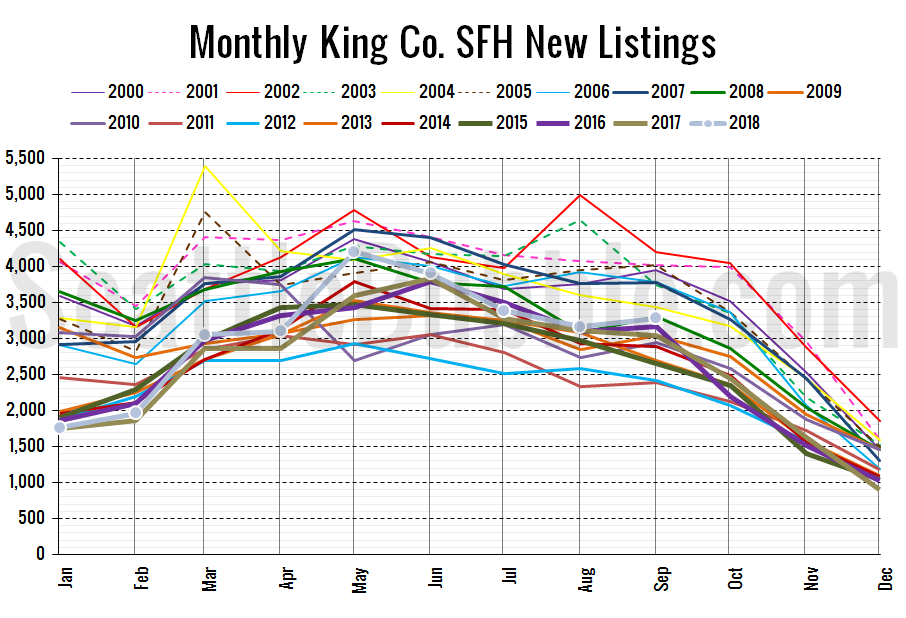
Here’s the chart of new listings:
New listings were up eight percent from a year ago, and edged up slightly from August to September, which is fairly typical for this time of year.
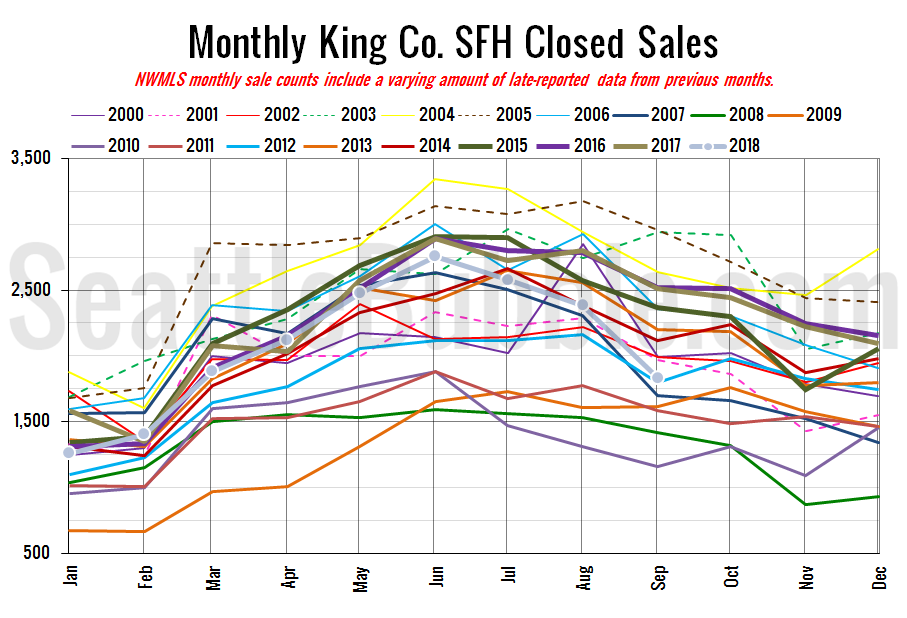
Here’s your closed sales yearly comparison chart:
Closed sales fell 23 percent between August and September. Last year over the same period closed sales dropped 10 percent. Year-over-year closed sales were down 27 percent—the largest drop since November 2010.
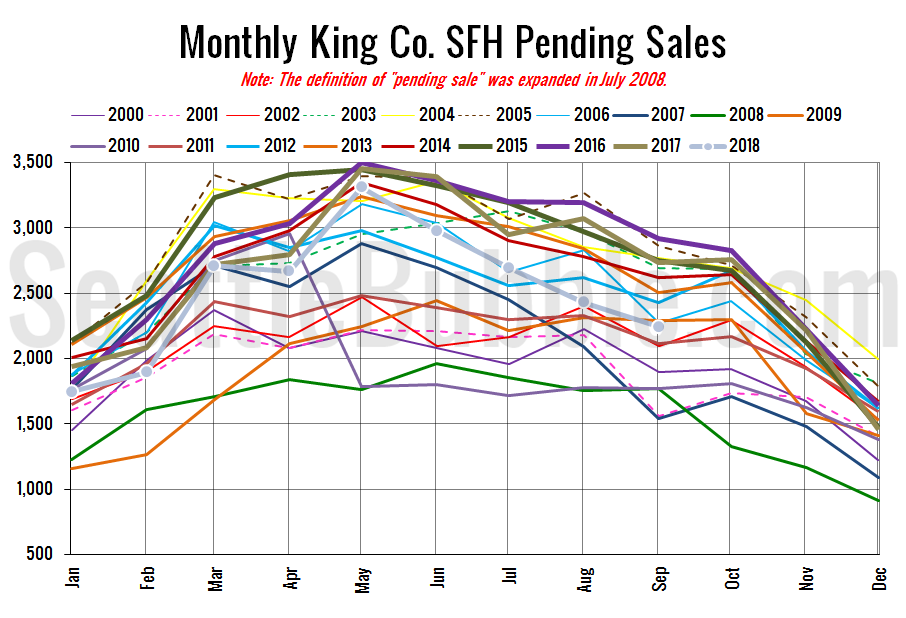
Pending sales were down eight percent from August to September, and were down 18 percent year-over-year.
Here’s the supply/demand YOY graph. “Demand” in this chart is represented by closed sales, which have had a consistent definition throughout the decade (unlike pending sales from NWMLS).
We’re now in totally uncharted territory for listings. We’ve never seen them growing this quickly year-over-year.
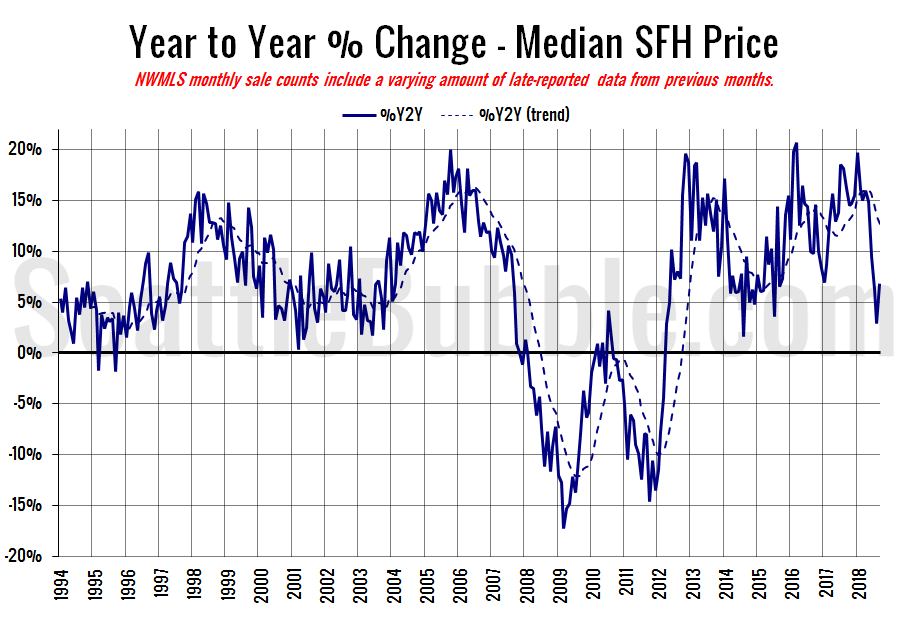
Here’s the median home price YOY change graph:
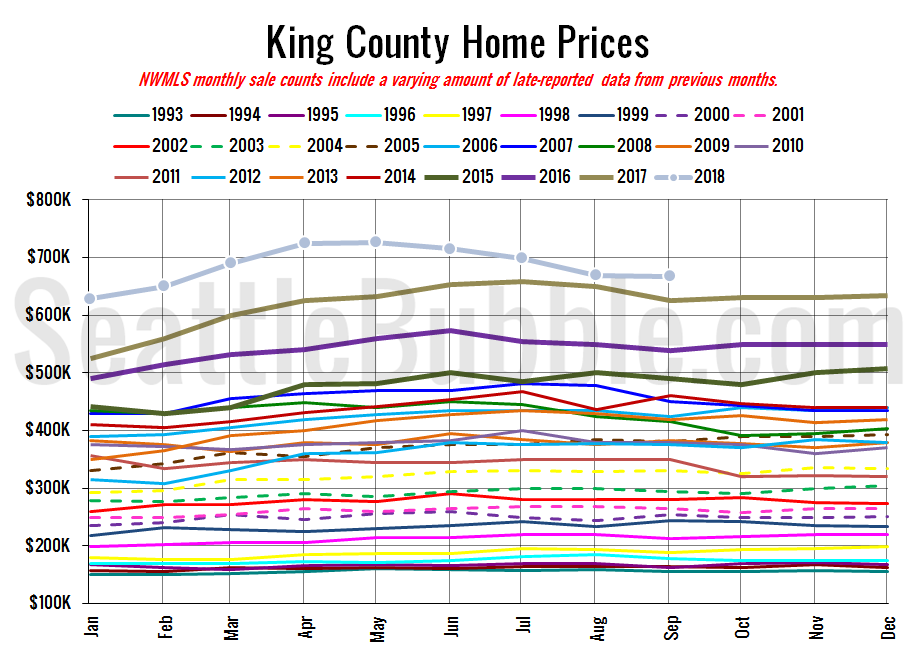
Year-over-year home price changes edged up from August to September, only because last year prices fell in September but this year they were basically flat, as you can see in the next chart.
And lastly, here is the chart comparing King County SFH prices each month for every year back to 1994 (not adjusted for inflation).
September 2018: $668,000
July 2007: $481,000 (previous cycle high)
