Get access to the full spreadsheets used to make the charts in this and other posts, and support the ongoing work on this site by becoming a member of Seattle Bubble.
With September’s stats in hand, let’s look at broader Puget Sound area. Here’s the latest update to our “Around the Sound” statistics for King, Snohomish, Pierce, Kitsap, Thurston, Island, Skagit, and Whatcom counties.
First up, a summary table:
| September 2018 | King | Snohomish | Pierce | Kitsap | Thurston | Island | Skagit | Whatcom |
|---|---|---|---|---|---|---|---|---|
| Median Price | $668,000 | $484,995 | $352,750 | $355,706 | $317,150 | $362,750 | $365,000 | $378,000 |
| Price YOY | +6.9% | +7.8% | +10.7% | +12.9% | +7.5% | -2.0% | +10.7% | +8.0% |
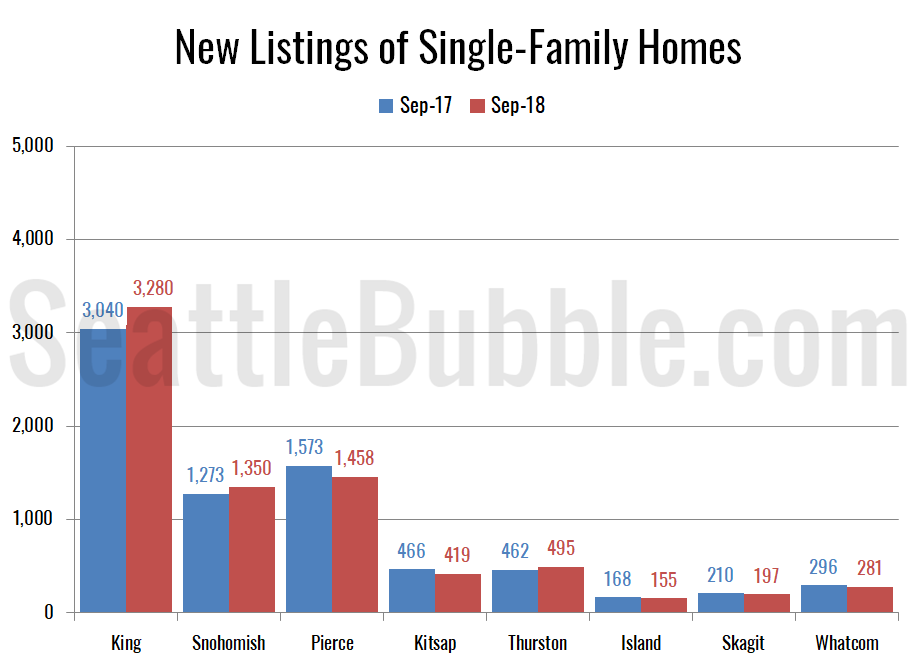
| New Listings | 3,280 | 1,350 | 1,458 | 419 | 495 | 155 | 197 | 281 |
| New Listings YOY | +7.9% | +6.0% | -7.3% | -10.1% | +7.1% | -7.7% | -6.2% | -5.1% |
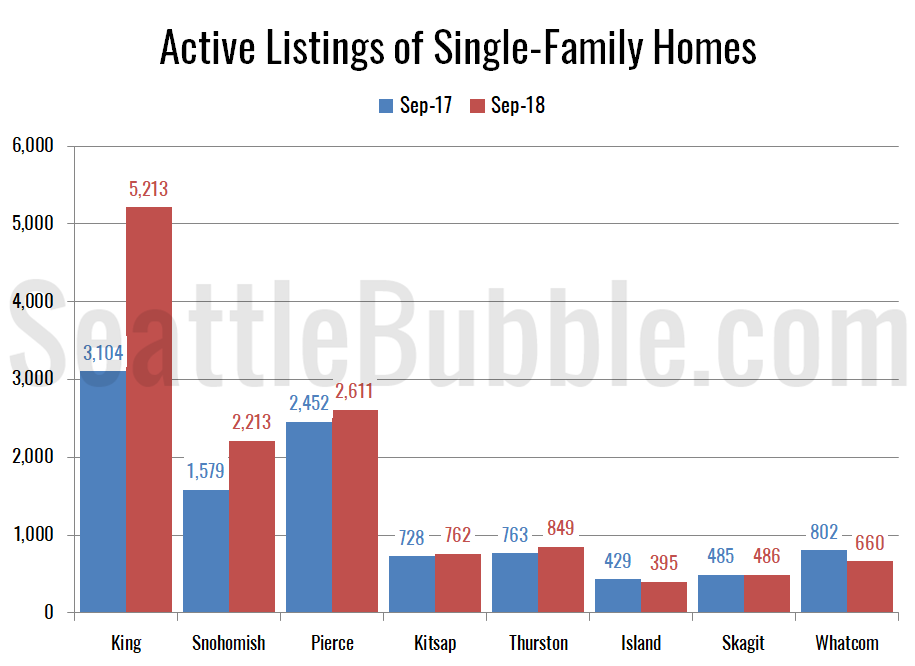
| Active Inventory | 5,213 | 2,213 | 2,611 | 762 | 849 | 395 | 486 | 660 |
| Inventory YOY | +67.9% | +40.2% | +6.5% | +4.7% | +11.3% | -7.9% | +0.2% | -17.7% |
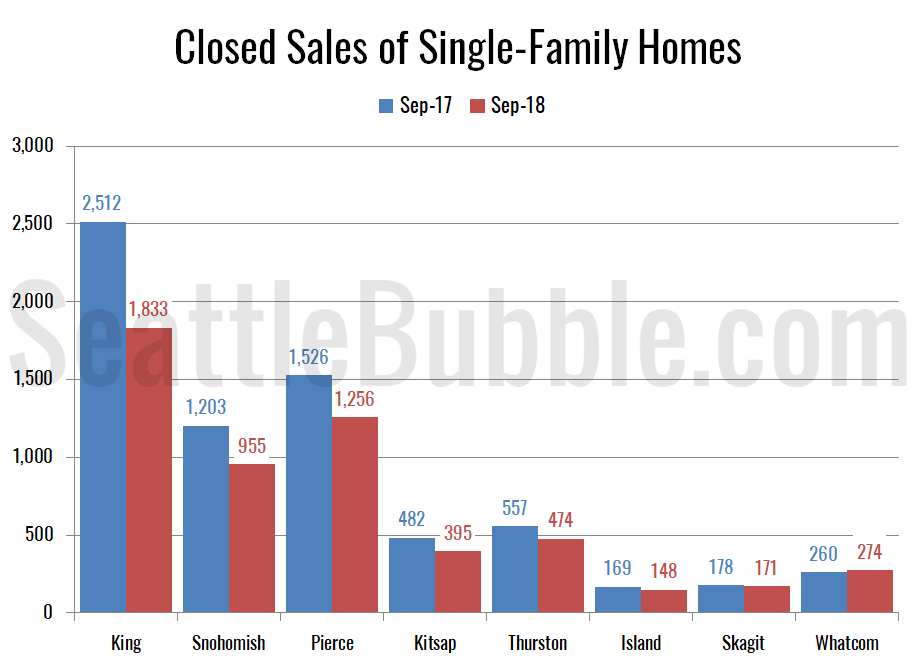
| Closed Sales | 1,833 | 955 | 1,256 | 395 | 474 | 148 | 171 | 274 |
| Sales YOY | -27.0% | -20.6% | -17.7% | -18.0% | -14.9% | -12.4% | -3.9% | +5.4% |
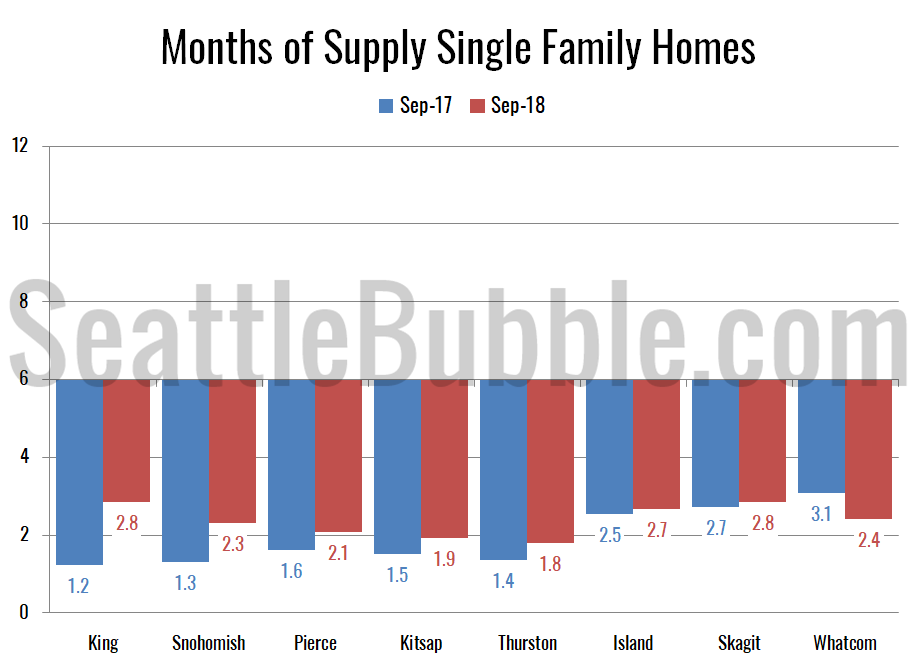
| Months of Supply | 2.8 | 2.3 | 2.1 | 1.9 | 1.8 | 2.7 | 2.8 | 2.4 |
The biggest gains in new listings and active inventory are still in King County. Snohomish, Pierce, Kitsap and Thurston all also saw some decent gains in inventory, but in Island, Skagit, and Whatcom inventory was flat or still down. Meanwhile, closed sales are falling everywhere but Whatcom.
Here’s a look at new listings across the region:
Only King, Snohomish, and Thurston saw year-over-year gains in new listings, while Pierce, Kitsap, Island, Skagit, and Whatcom all continued to fall.
Next up: Active inventory.
Inventory was up sizeably from year earlier in King, Snohomish, and Thurston. It also edged up in Pierce and Kitsap. Meanwhile, inventory in Whatcom county has been down double-digits for the past five months in a row.
Here’s the chart of median prices compared to a year ago. Island County actually saw a slight decrease in prices, but they were still up everywhere else.
Sales are now significantly declining pretty much everywhere but the furthest-out counties. Skagit saw just a 3.9 percent drop and Whatcom saw a 5.4 percent gain, but every other county had double-digit declines.
We’re still in a major sellers’ market… but the trend looks at least somewhat hopeful for buyers, with every county except Whatcom inching closer to that magical “balanced market” number of six months of supply.
In summary: The inventory surge has spread outside of King County, as sales slow and listings pile up. The one notable exception to this trend so far is up north in Whatcom County. I’m not sure exactly what’s going on up there, but for some reason the market up there is not cooling down this year the way it is pretty much everywhere else.
If there is certain data you would like to see or ways you would like to see the data presented differently, drop a comment below and let me know.


