Remember, you can always get access to the Seattle Bubble spreadsheets by supporting my ongoing work as a member of Seattle Bubble.
Hey look who it is. That Seattle Bubble guy. He’s not gone after all. Seriously though, everything is fine. Things just got a bit busy.
Let’s have a look at the May stats, shall we?
In summary: Although the market is definitely not as hot as it was a year ago, it’s no longer moving strongly in a direction favorable to buyers. Sales are basically flat and the growth in inventory is slowing. I had hoped the market would soften more, but it doesn’t look like that’s going to happen this year.
Here’s the snapshot of all the data as far back as my historical information goes, with the latest, high, and low values highlighted for each series:
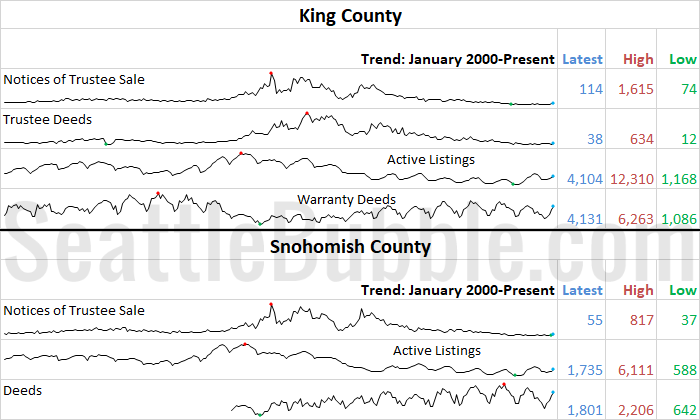
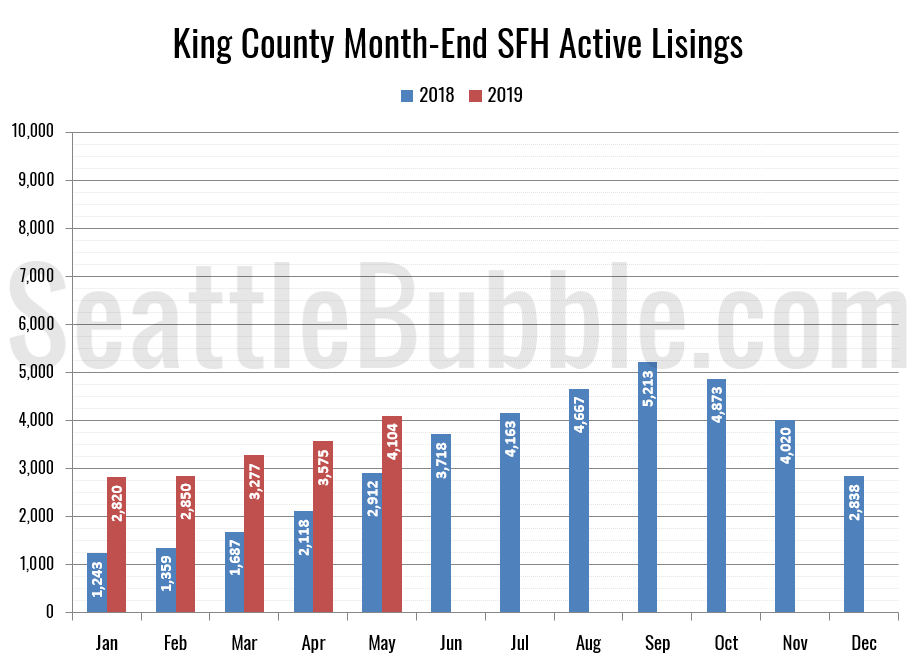
First up, let’s look at our inventory charts, updated with previous month’s inventory data from the NWMLS.
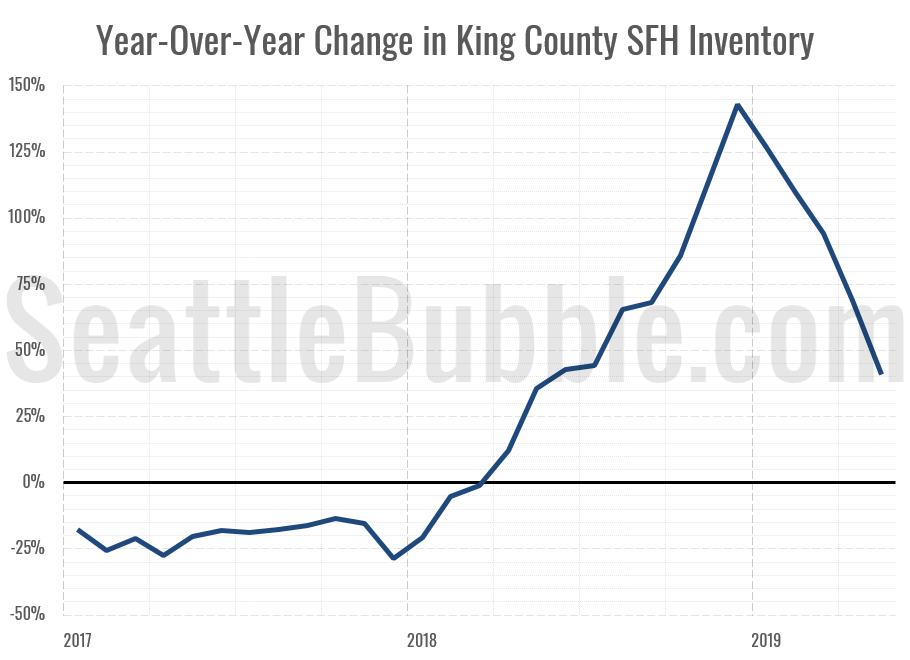
The number of homes on the market in King County rose 15 percent from April to May, and year-over-year listings are up 41 percent from May 2018. That’s a good gain, but the smallest one since May 2018. Here’s what the year-over-year trend looks like for King County listings since January 2017:
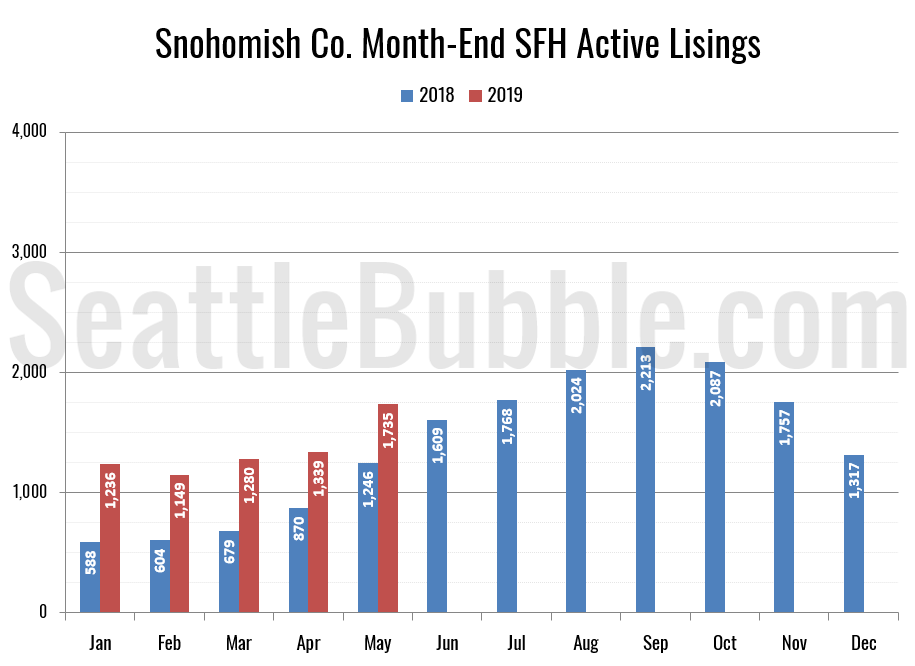
In Snohomish County inventory rose 30 percent month-over-month, and the year-over-year growth was up 39 percent. It’s a similar story in Snohomish, with the smallest gain since August.
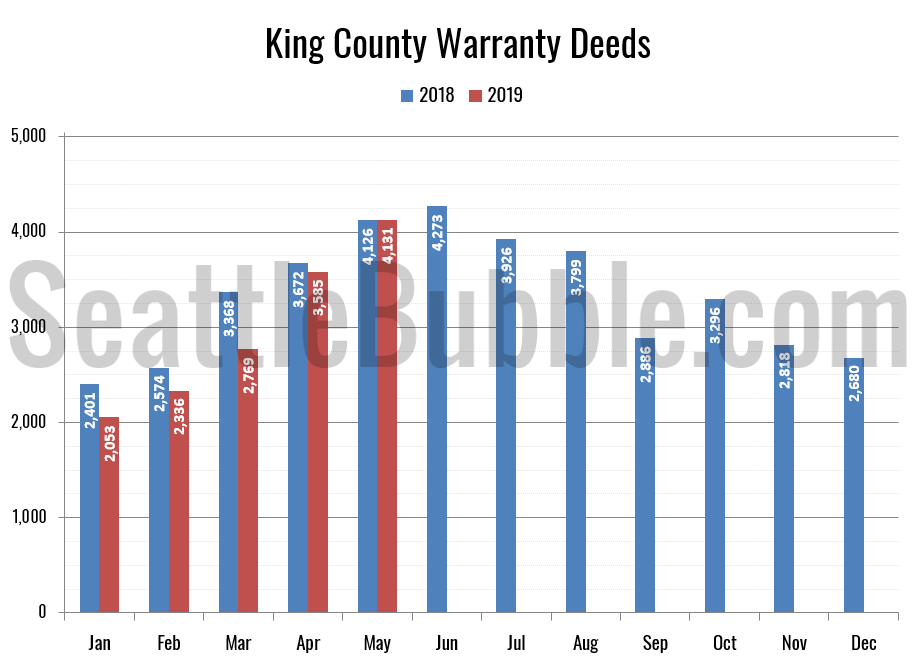
Next, let’s look at total home sales as measured by the number of “Warranty Deeds” filed with King County:
Sales in King County rose 15 percent between April and May (a year ago they rose 12 percent over the same period), and were flat year-over-year.
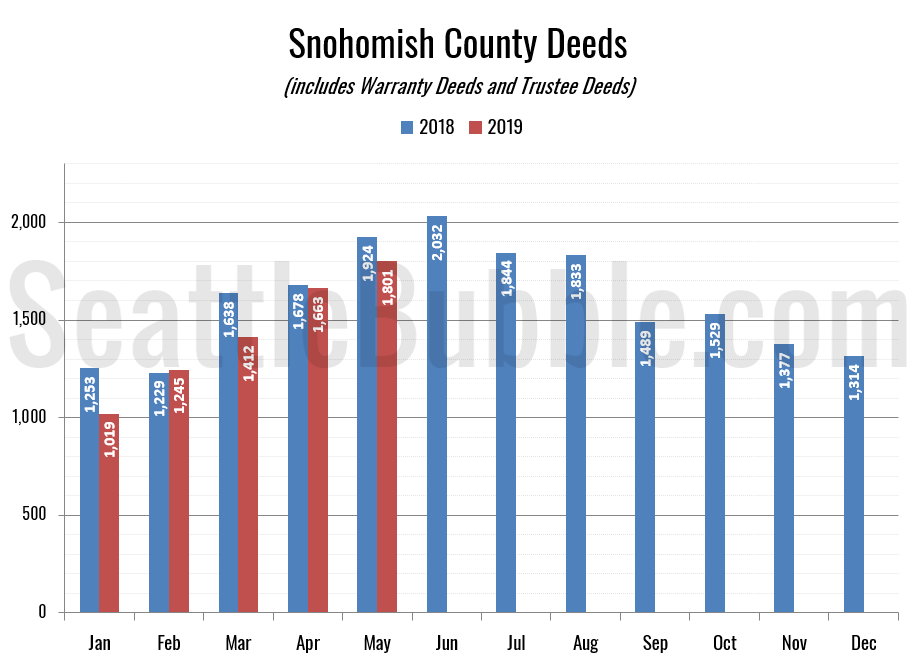
Here’s a look at Snohomish County Deeds, but keep in mind that Snohomish County files Warranty Deeds (regular sales) and Trustee Deeds (bank foreclosure repossessions) together under the category of “Deeds (except QCDS),” so this chart is not as good a measure of plain vanilla sales as the Warranty Deed only data we have in King County.
Deeds in Snohomish rose 8 percent month-over-month (in the same period last year they were up 15 percent) and were down 6 percent from a year earlier.
Hit the jump for the foreclosure charts.
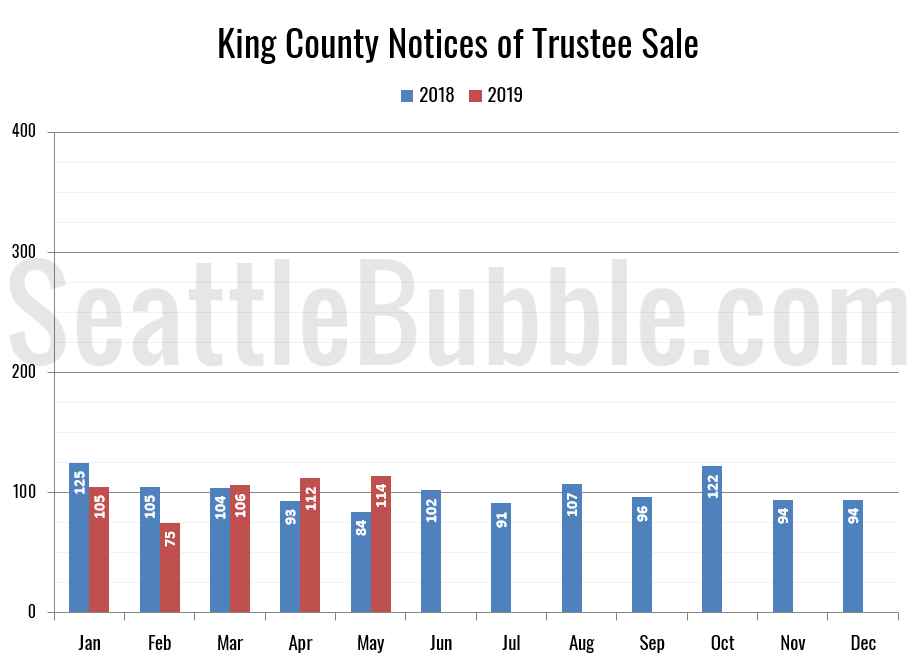
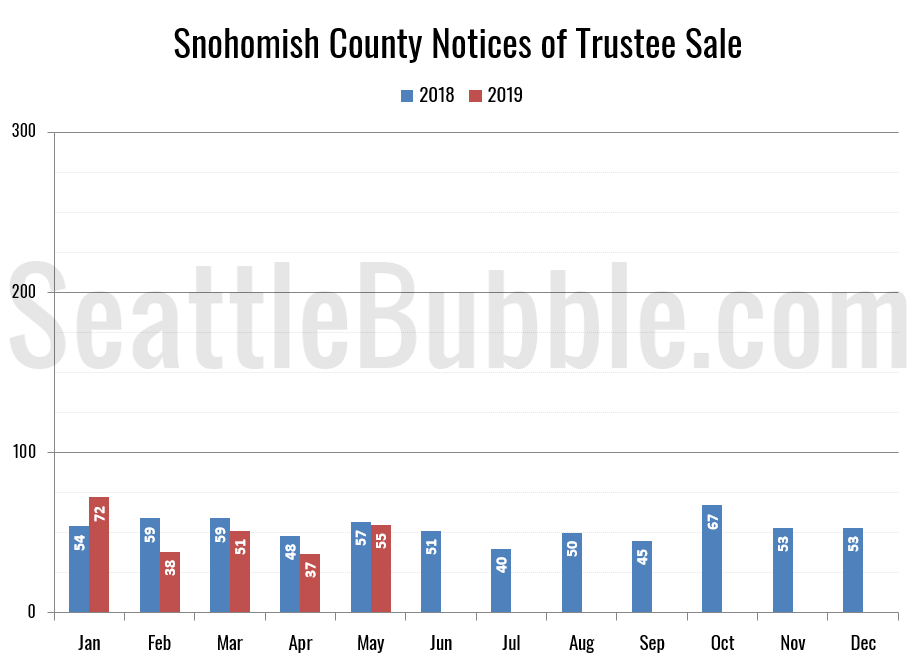
Next, here’s Notices of Trustee Sale, which are an indication of the number of homes currently in the foreclosure process:
Foreclosure notices in King County were up 36 percent from a year ago and Snohomish County foreclosure notices were down four percent from last year. Since the numbers are so low, recent changes can appear large in percentage terms, but we’re talking about changes of just a few dozen month to month and compared to the prior year.
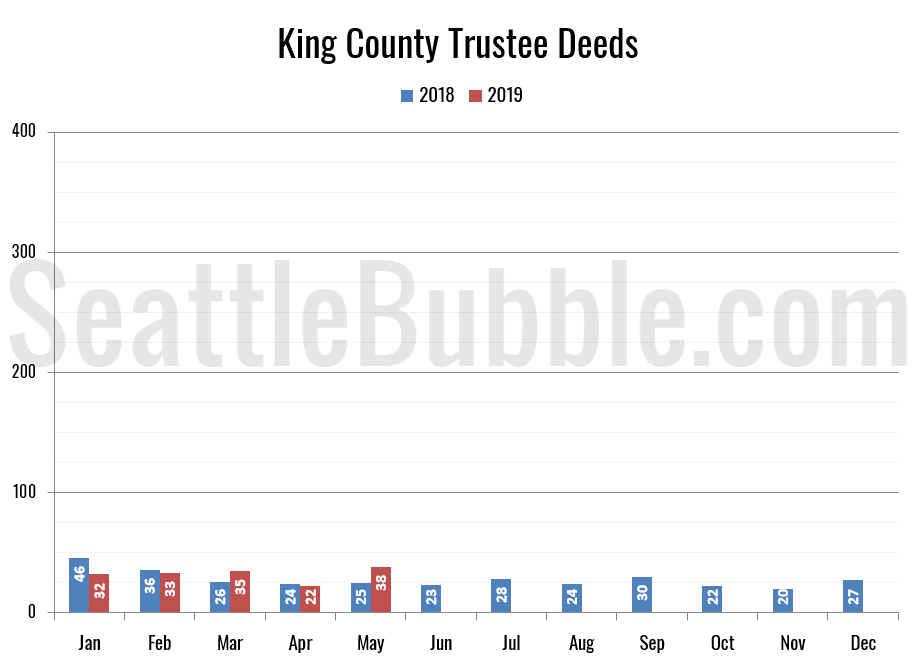
Here’s another measure of foreclosures for King County, looking at Trustee Deeds, which is the type of document filed with the county when the bank actually repossesses a house through the trustee auction process. Note that there are other ways for the bank to repossess a house that result in different documents being filed, such as when a borrower “turns in the keys” and files a “Deed in Lieu of Foreclosure.”
Trustee Deeds were up 52 percent from a year ago.
Note that most of the charts above are based on broad county-wide data that is available through a simple search of King County and Snohomish County public records. If you have additional stats you’d like to see in the preview, drop a line in the comments and I’ll see what I can do.
Stay tuned later this month a for more detailed look at each of these metrics as the “official” data is released from various sources.
