Get access to the full spreadsheets used to make the charts in this and other posts, and support the ongoing work on this site by becoming a member of Seattle Bubble.
I promised an updated look at June data for the outlying counties, so let’s have a look at that. Here’s the latest update to our “Around the Sound” statistics for King, Snohomish, Pierce, Kitsap, Thurston, Island, Skagit, and Whatcom counties.
First up, a summary table:
| June 2019 | King | Snohomish | Pierce | Kitsap | Thurston | Island | Skagit | Whatcom |
|---|---|---|---|---|---|---|---|---|
| Median Price | $695,000 | $515,000 | $376,500 | $391,657 | $344,000 | $402,500 | $380,000 | $417,750 |
| Price YOY | (2.8%) | 0.7% | 7.3% | 10.6% | 5.8% | 5.1% | 11.8% | 7.1% |
| New Listings | 3,487 | 1,480 | 1,751 | 491 | 618 | 207 | 273 | 397 |
| New Listings YOY | (10.7%) | (12.2%) | (10.4%) | (17.8%) | (2.2%) | (12.7%) | 7.1% | (6.6%) |
| Active Inventory | 4,625 | 1,841 | 1,945 | 611 | 569 | 350 | 449 | 654 |
| Inventory YOY | 24.4% | 14.4% | (7.9%) | 3.7% | (14.4%) | 2.6% | 6.1% | 7.2% |
| Closed Sales | 2,718 | 1,215 | 1,521 | 432 | 553 | 186 | 213 | 326 |
| Sales YOY | (1.5%) | (1.7%) | (8.6%) | (5.5%) | (0.5%) | (11.0%) | 0.9% | (4.4%) |
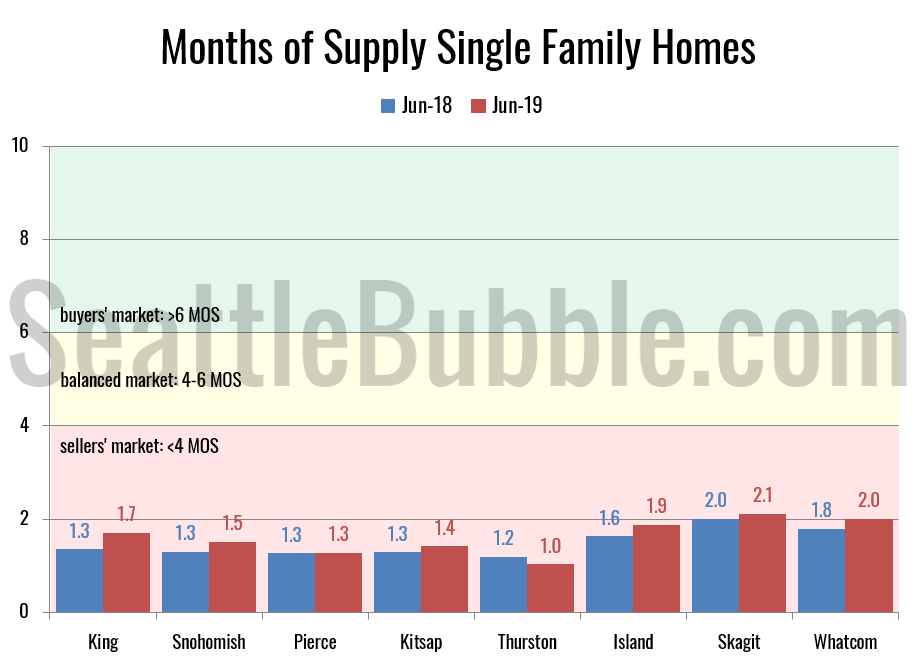
| Months of Supply | 1.7 | 1.5 | 1.3 | 1.4 | 1.0 | 1.9 | 2.1 | 2.0 |
King County is the only place where prices are declining, and it also has the largest increase in active listings compared to a year ago. On the flip side, pending sales were up the most in King County, and it had one of the smallest declines in closed sales (sales rose in Skagit though). In most of the other Puget Sound counties, sales are declining, and listings are either falling or not increasing by much, and prices are rising.
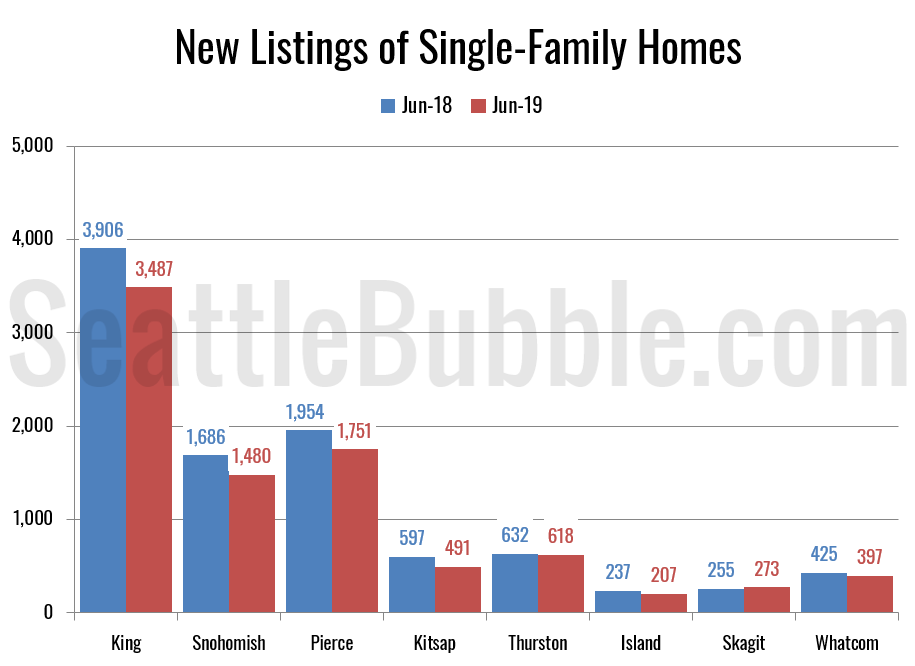
Here’s a look at new listings across the region:
New listings fell everywhere but Skagit County in June. Bad news for buyers hoping to find more selection as we head into the summer.
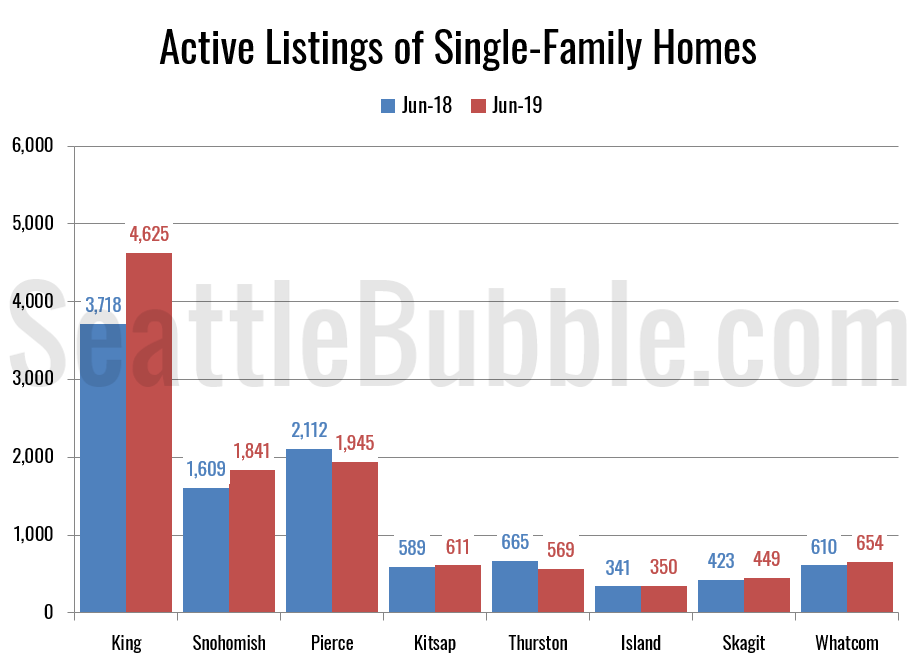
Next up: Active inventory.
Inventory fell in Thurston and Pierce counties, but increased everywhere else. King and Snohomish saw the biggest gains, but both of those were far smaller than the gains we saw late last year and earlier this year.
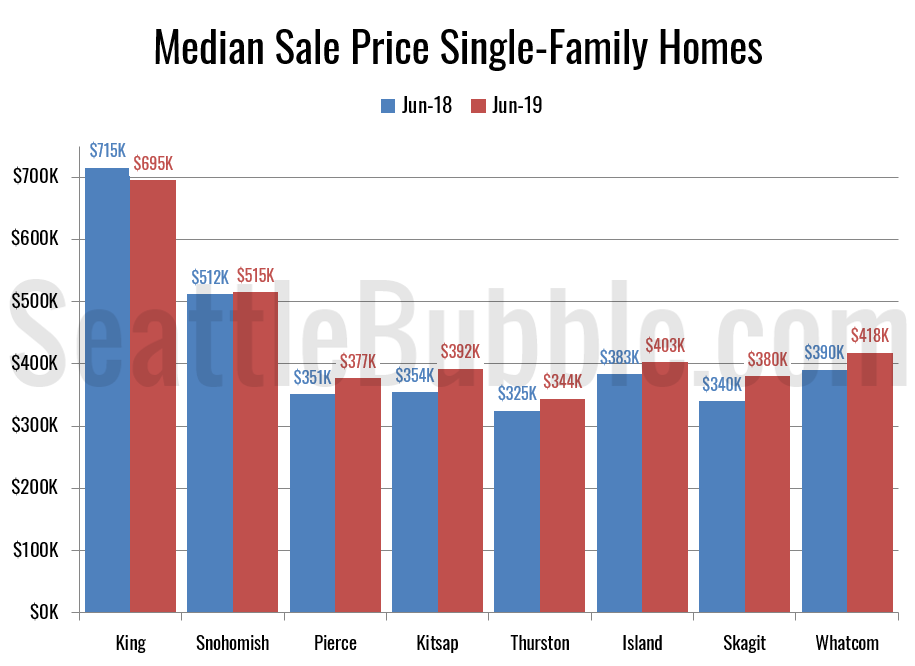
Here’s the chart of median prices compared to a year ago.
The biggest increase in home prices in June was Skagit, where prices rose 12 percent. Kitsap was close behind with an 11 percent increase. Every other county was in the single digits.
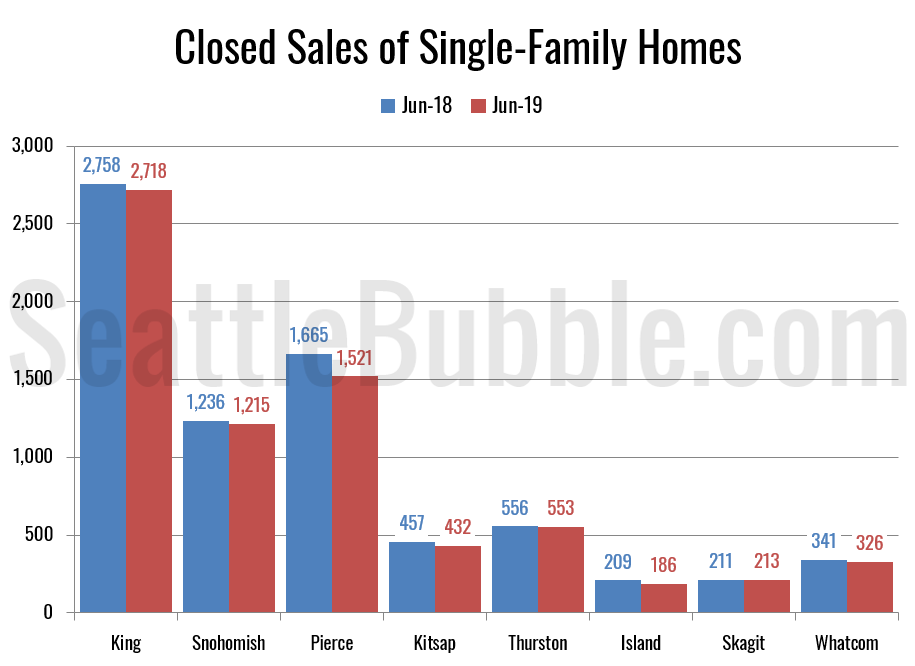
Closed sales were down in every county but Skagit, where they managed an increase of less than one percent.
This graph is the most telling—every county is still a very strong sellers’ market. Most counties are slightly better for buyers than they were a year ago, but we’ve still got a long ways to go before we get even close to what most people would call a “balanced” market (4-6 months of supply).
If there is certain data you would like to see or ways you would like to see the data presented differently, drop a comment below and let me know.
