Get access to the full spreadsheets used to make the charts in this and other posts, as well as a variety of additional insider benefits by becoming a member of Seattle Bubble.
The NWMLS published their August stats yesterday, so let’s take a look at how the month shook out for the housing market.
As we mentioned in yesterday’s preview post, the biggest story is a sudden, renewed shortage of inventory.
Before we get into our detailed monthly stats, here’s a quick look at their press release.
Home Buyers Seeking Affordability Are Expanding Search Outside Greater Seattle Job Centers
Depleted inventory continues to frustrate would-be buyers in Western Washington. Many of these potential homeowners are expanding their search beyond the major job centers in King County, according to market watchers who commented on the latest statistics from Northwest Multiple Listing Service.
…
“While August is always a slower time for listings and sales, what is really surprising this year is the decrease in new listings taken, while pending sales increased,” observed Mike Grady, president and COO of Coldwell Banker Bain.
…
Multiple offers are still commonplace with many buyers walking away disappointed, according to Wilson. “Traffic is strong at open houses and our average market time is still very low for correctly priced homes,” he added.“The August numbers offered a few interesting nuggets,” stated OB Jacobi, president of Windermere Real Estate. “The Seattle area housing market is still coming off the ‘sugar high’ that we saw last summer, but homes sales and prices are stabilizing, which is reassuring to both buyers and sellers.”
Quick note: According to data from Redfin, multiple offers are far from “commonplace” now. In August fewer than 10 percent of offers in the Seattle area faced competition. (Disclosure: Tim works for Redfin.)
However, new listings are indeed way down. Let’s get into the data to quantify the drop.
NWMLS monthly reports include an undisclosed and varying number of
sales from previous months in their pending and closed sales statistics.
Here’s your King County SFH summary, with the arrows to show whether the year-over-year direction of each indicator is favorable or unfavorable news for buyers and sellers (green = favorable, red = unfavorable):
| August 2019 | Number | MOM | YOY | Buyers | Sellers |
|---|---|---|---|---|---|
| Active Listings | 4,194 | -4.7% | -10.1% |  |
 |
| Closed Sales | 2,531 | -3.9% | +6.1% |  |
 |
| SAAS (?) | 1.11 | -4.8% | -22.9% |  |
 |
| Pending Sales | 2,623 | -10.1% | +7.9% |  |
 |
| Months of Supply | 1.66 | -0.7% | -15.3% |  |
 |
| Median Price* | $670,000 | -1.5% | +0.1% |  |
 |
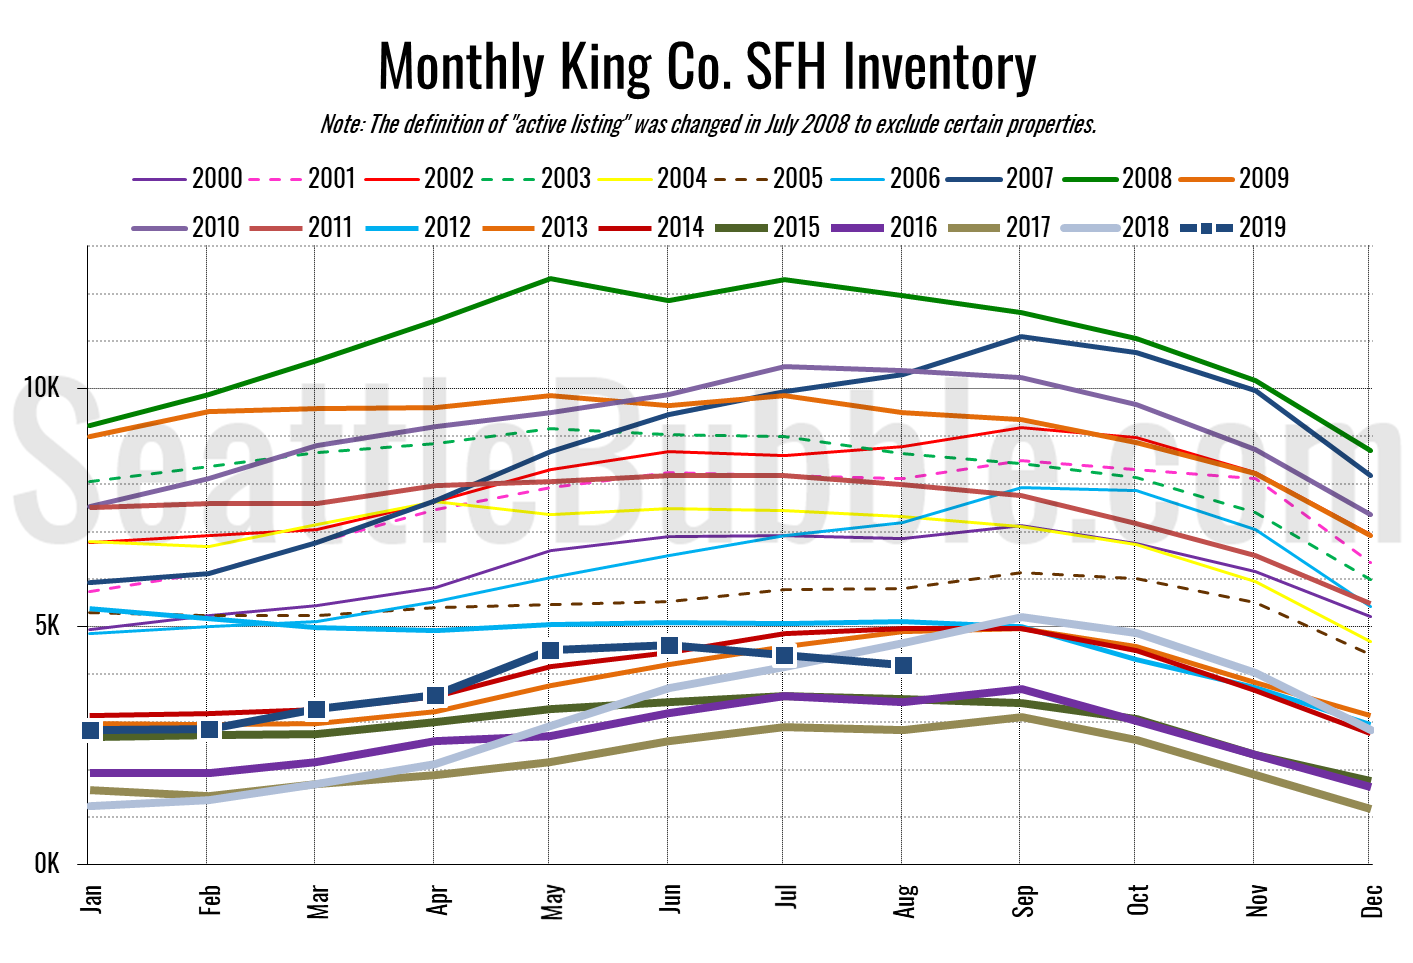
Here’s the graph of inventory with each year overlaid on the same chart.
Inventory fell five percent from July to August. During the same period a year ago, inventory rose 12 percent. The 10 percent year-over-year drop in inventory is the biggest decline we’ve seen since January 2018.
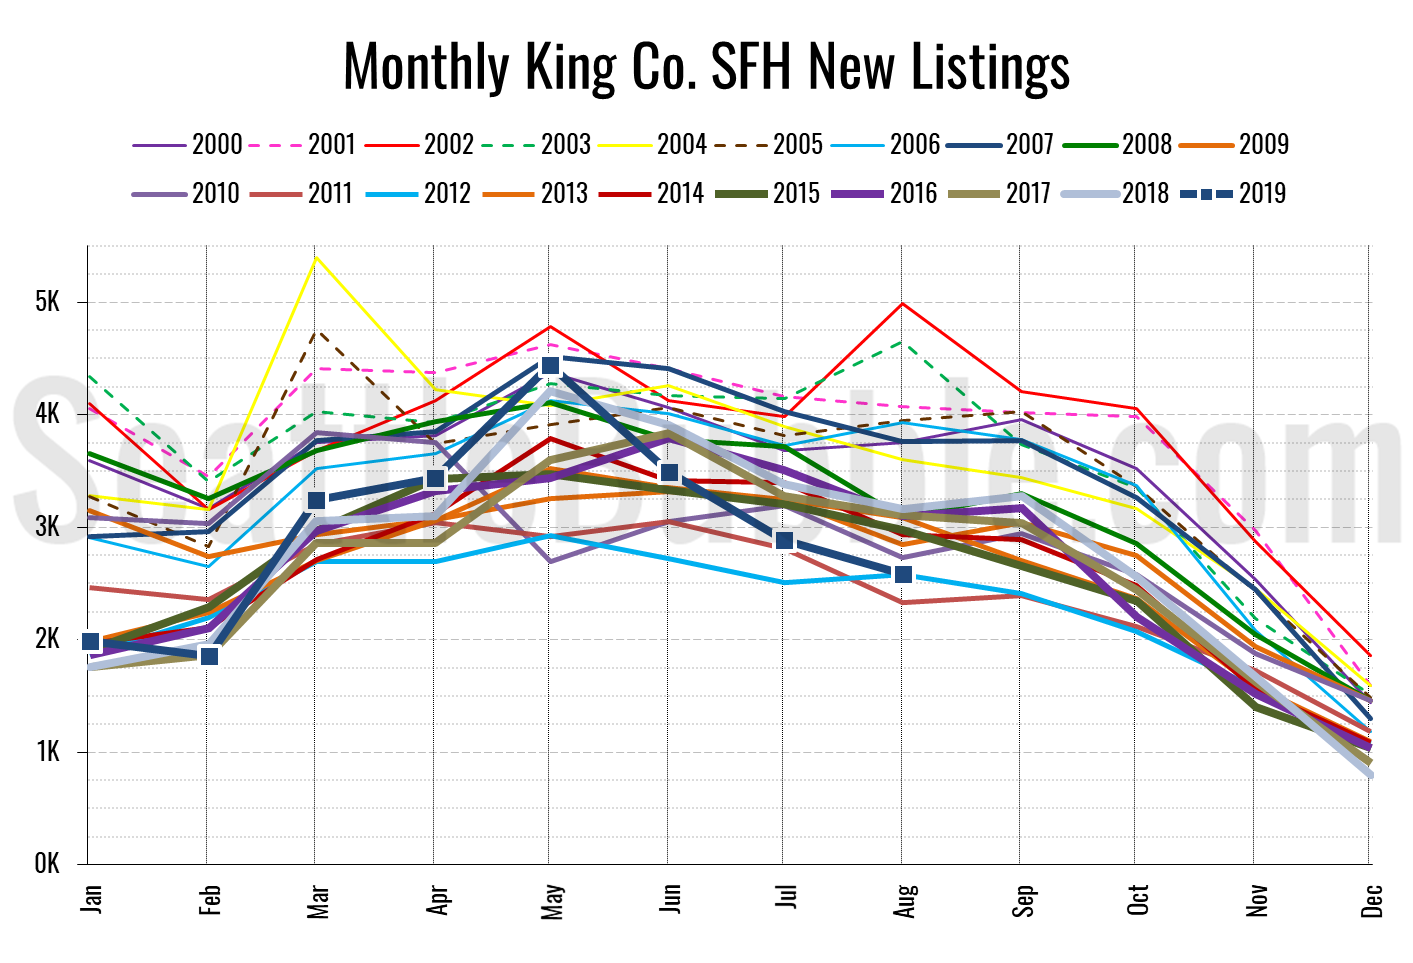
Here’s the chart of new listings:
New listings were down 10 percent from July to August, and were down 18 percent from a year ago. Only 2011 and 2012 saw fewer new listings in August than we had in 2019.
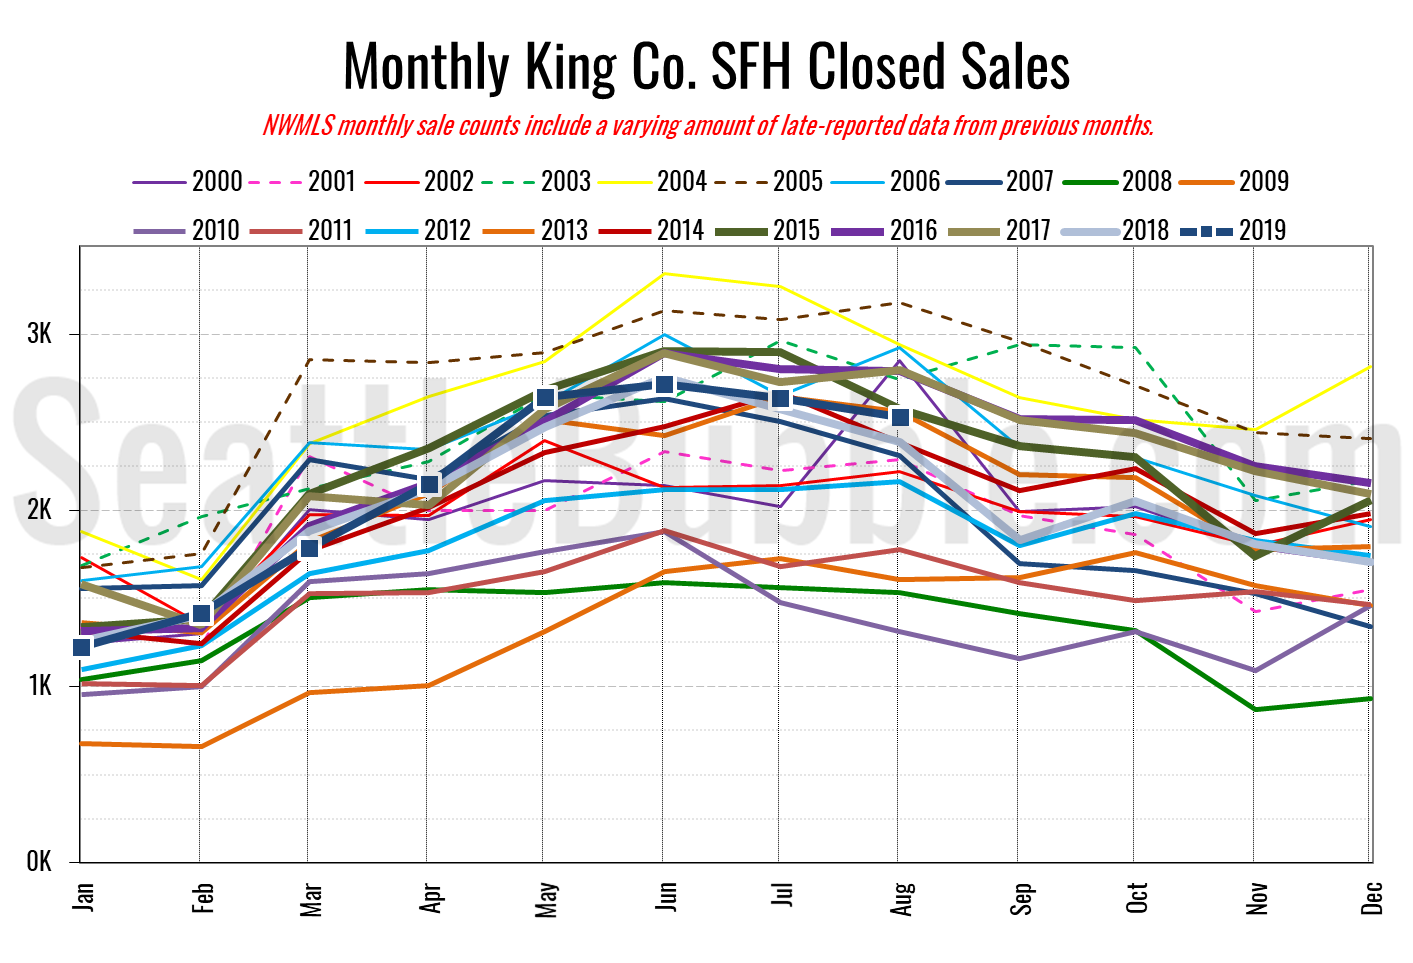
Here’s your closed sales yearly comparison chart:
Closed sales fell four percent between July and August, and were up six percent from last year. Closed sales have been in a fairly tight range between about 2,400 and 2,800 in August every year since 2013, and this year fell right in the middle of that range at 2,531.
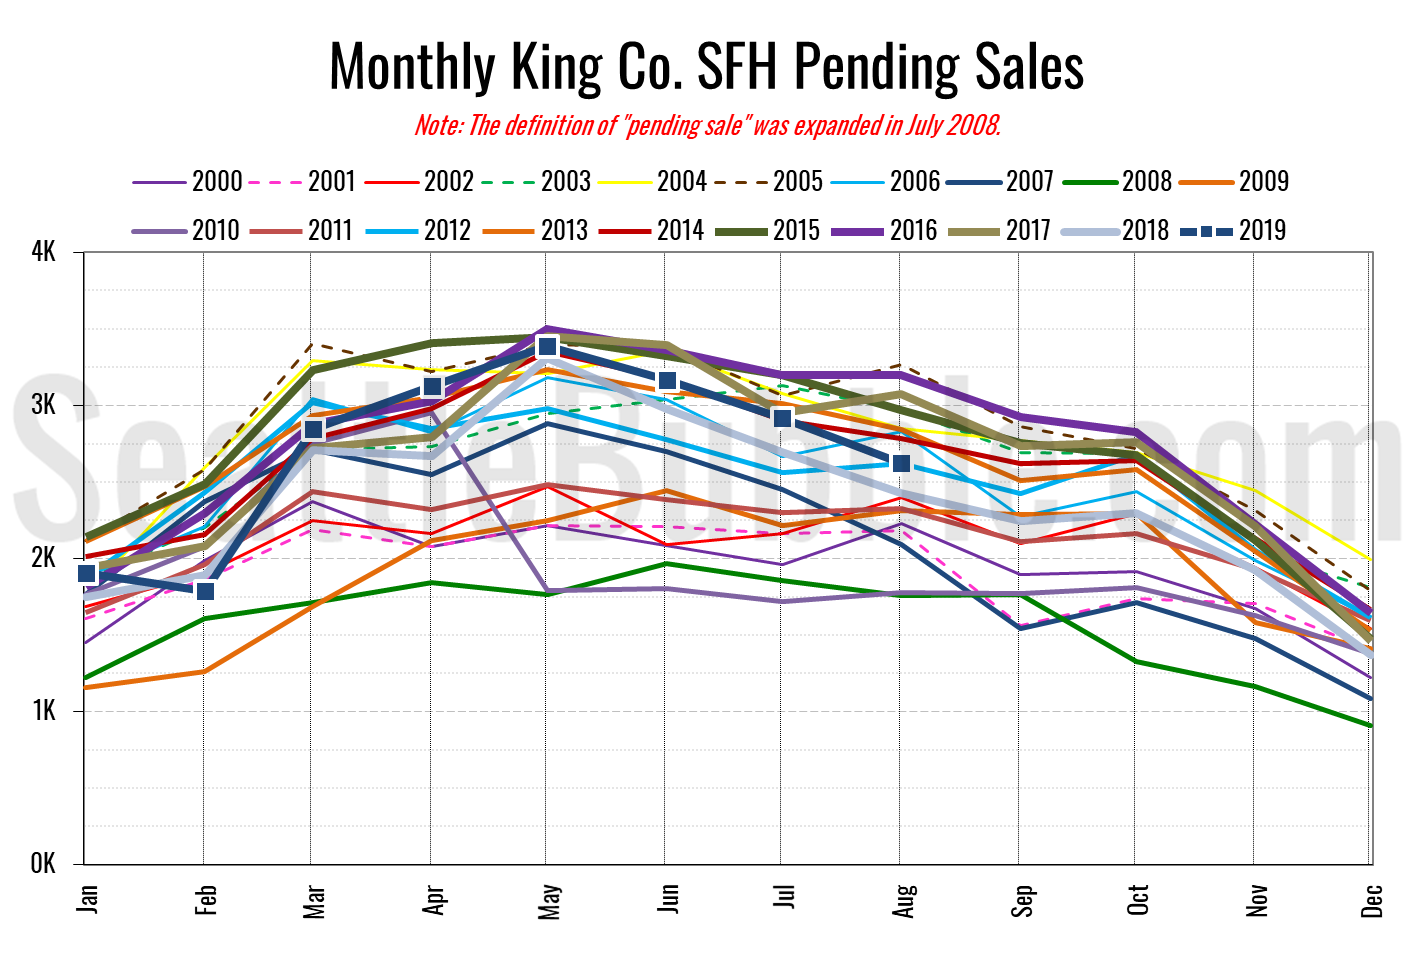
Pending sales fell 10 percent month-over-month but were up eight percent year-over-year.
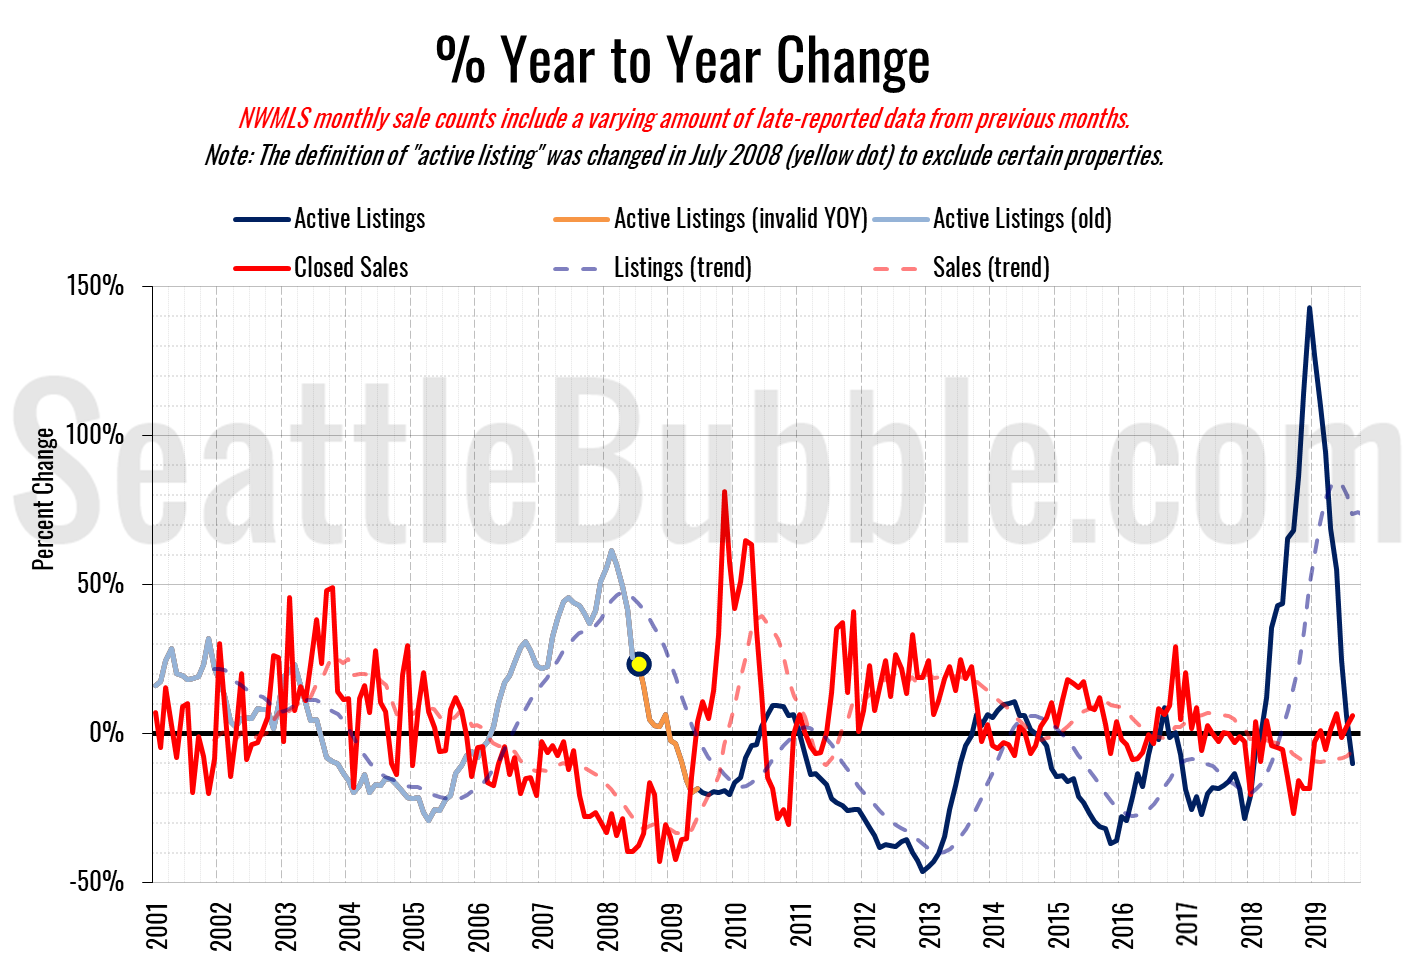
Here’s the supply/demand YOY graph. “Demand” in this chart is represented by closed sales, which have had a consistent definition throughout the decade (unlike pending sales from NWMLS).
The good news for buyers with respect to housing supply was short-lived. Supply is back in the red.
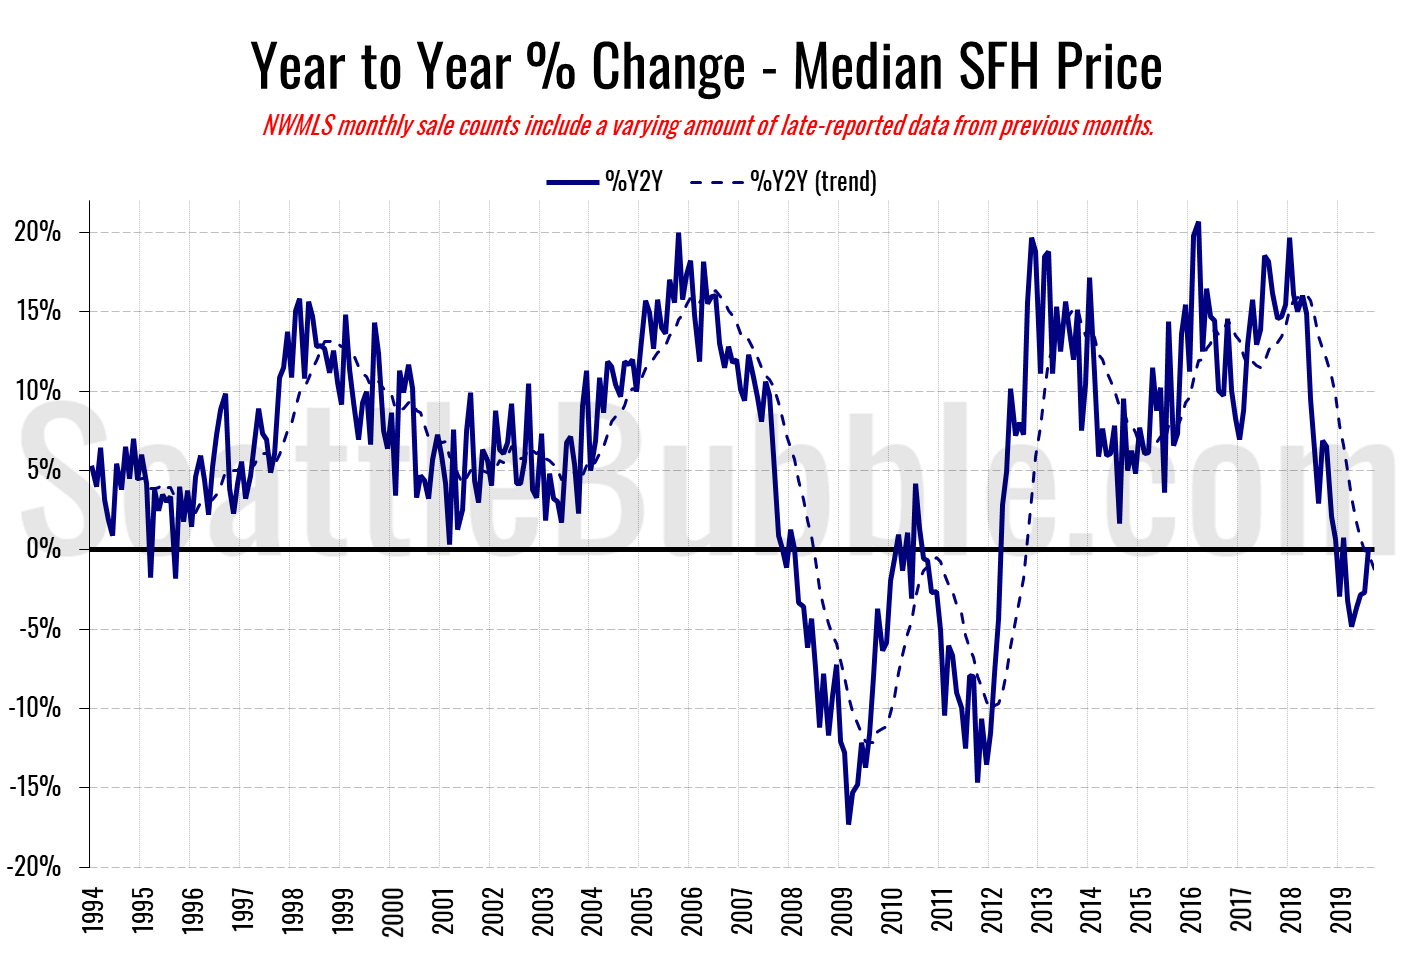
Here’s the median home price YOY change graph:
Home prices dipped a bit last month, but not by as much as they did this time last year, so we ended up back in the black year-over-year, just barely.
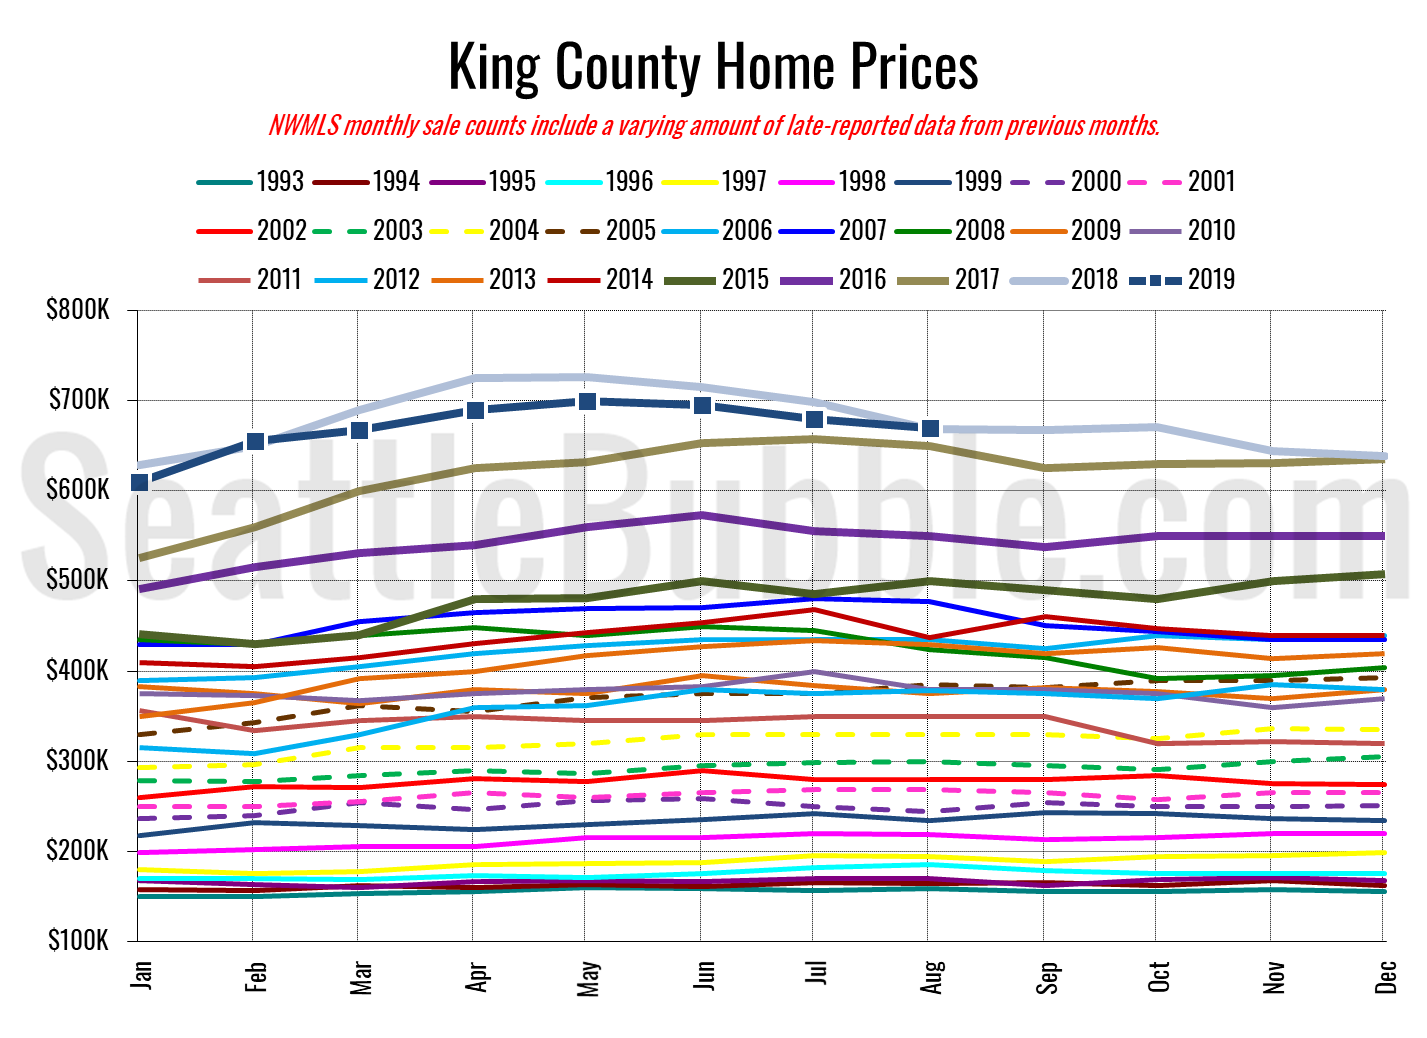
And lastly, here is the chart comparing King County SFH prices each month for every year back to 1994 (not adjusted for inflation).
August 2019: $670,000
August 2018: $669,000
July 2007: $481,000 (previous cycle high)
Here’s the article about these numbers from the Seattle Times: The market’s chilled out, but Seattle home prices still too hot for many first-time buyers
