Seattle Bubble spreadsheets are updated even when content isn’t frequently posted. You can get access to the spreadsheets by becoming a member of Seattle Bubble.
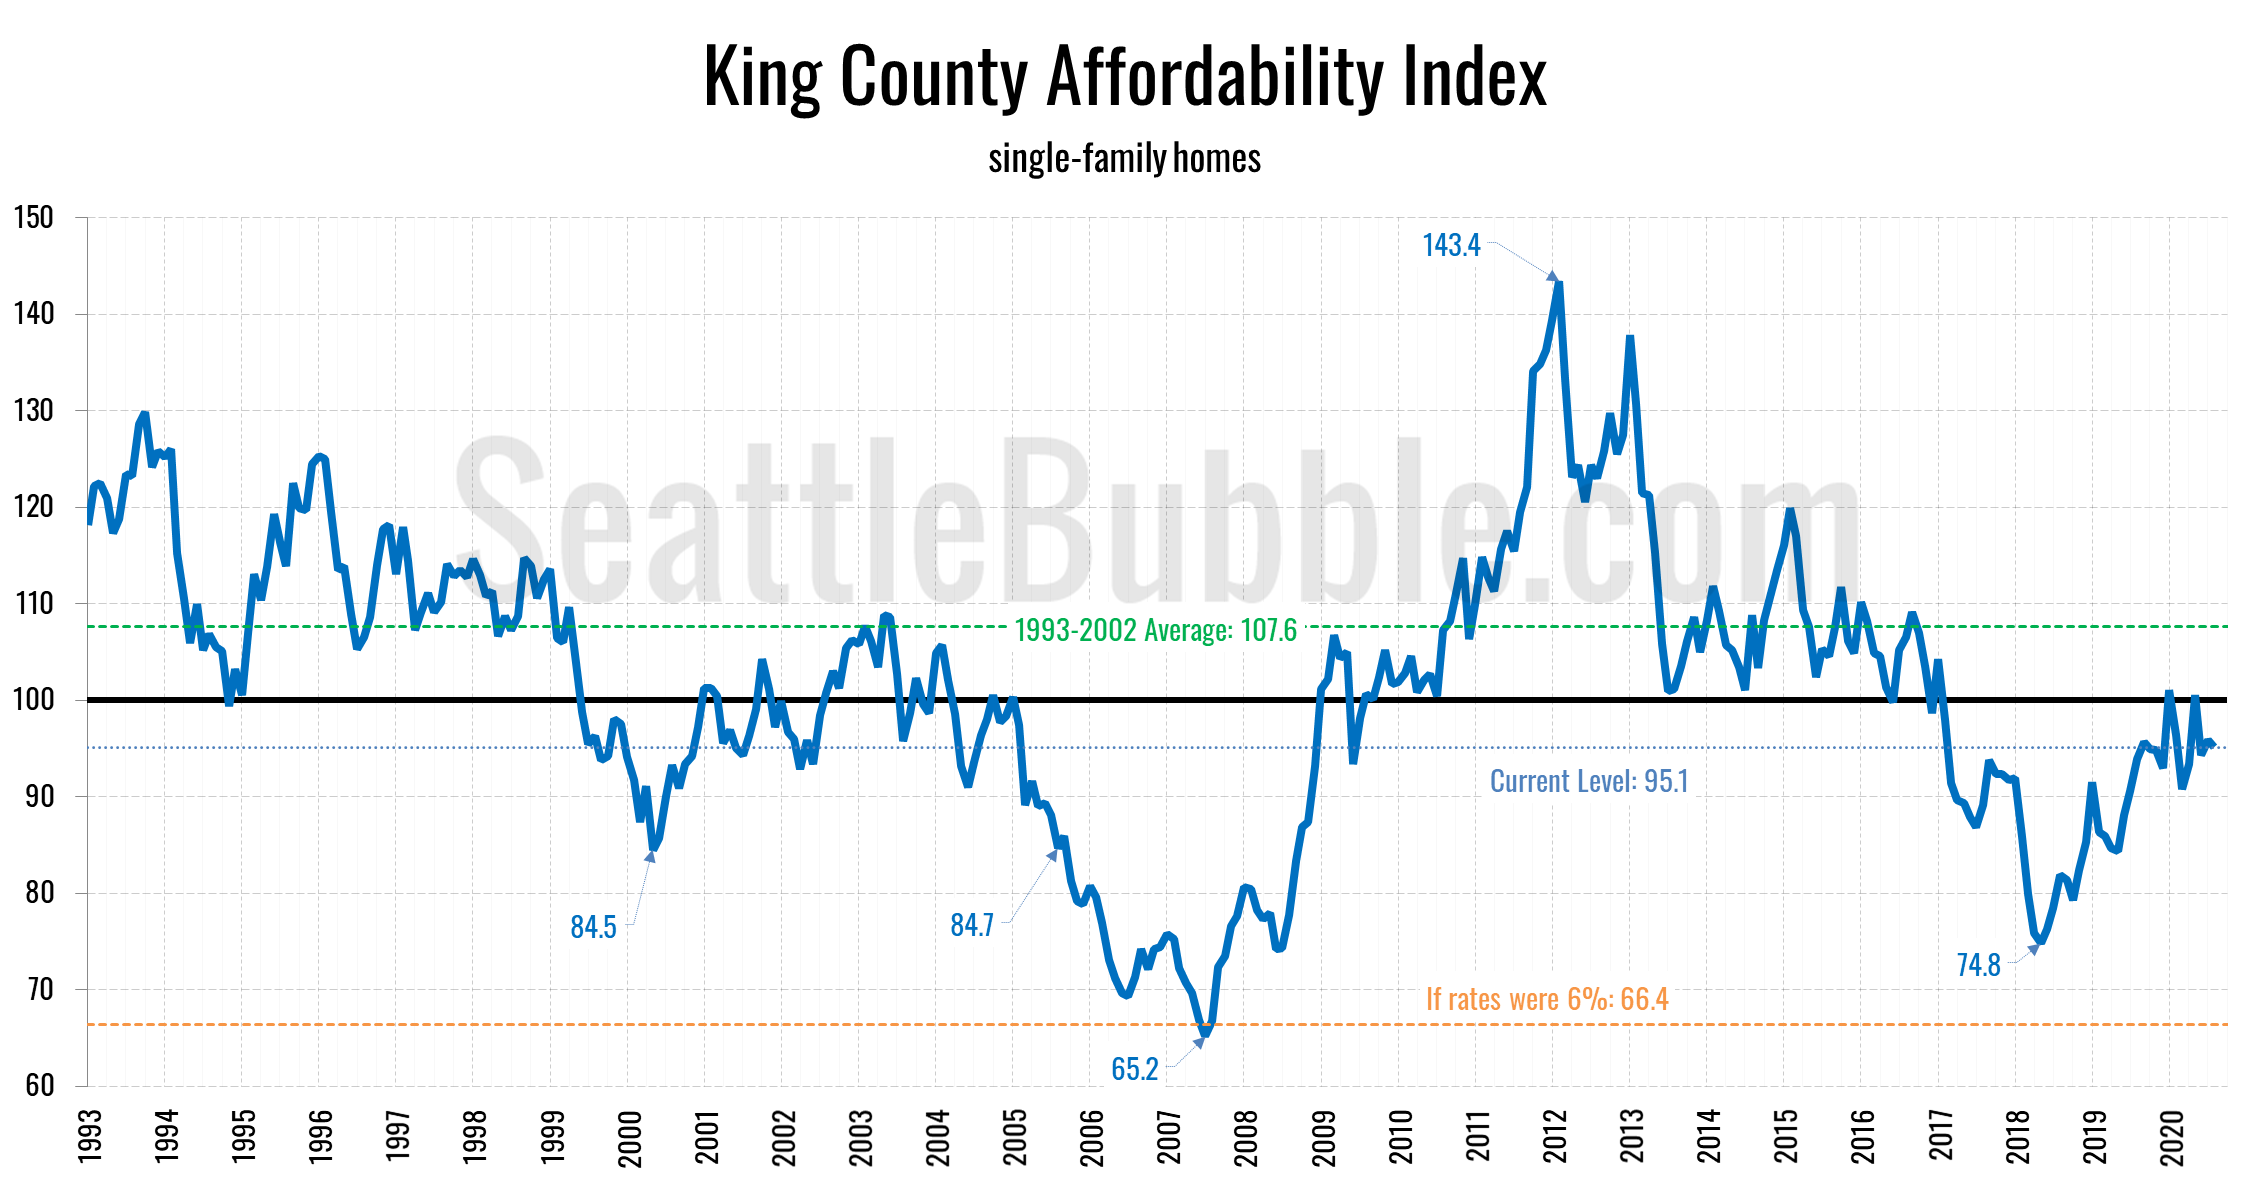
It’s been quite a while since we’ve had a look at our affordability index charts for the counties around Puget Sound, so let’s have a look at those charts. As of August, the affordability index currently sits at 95.1, which is somewhat lower than the 1993-2002 average of 107.6, but not ridiculously lower. For context, 69 percent of the 331 months on record back through 1993 have had a higher affordability index than what we had in August 2020.
An index level above 100 indicates that the monthly payment on a median-priced home costs less than 30% of the median household income. An index below 100 means that the monthly payment is over 30% of the median income.
I’ve marked where affordability would be if interest rates were at a more historically sane level of 6 percent—66.4, which is worse than every other month on record except July 2007, the absolute peak of the previus housing bubble. At that time interest rates were 6.7%, and if rates were that high today, the affordability index for King County single-family homes would be 61.7.
If rates went up to a more historically “normal” level of 8 percent (the average rate through the ’90s), the affordability index would be at 54.2—nine points below the record low level that was set in July 2007.
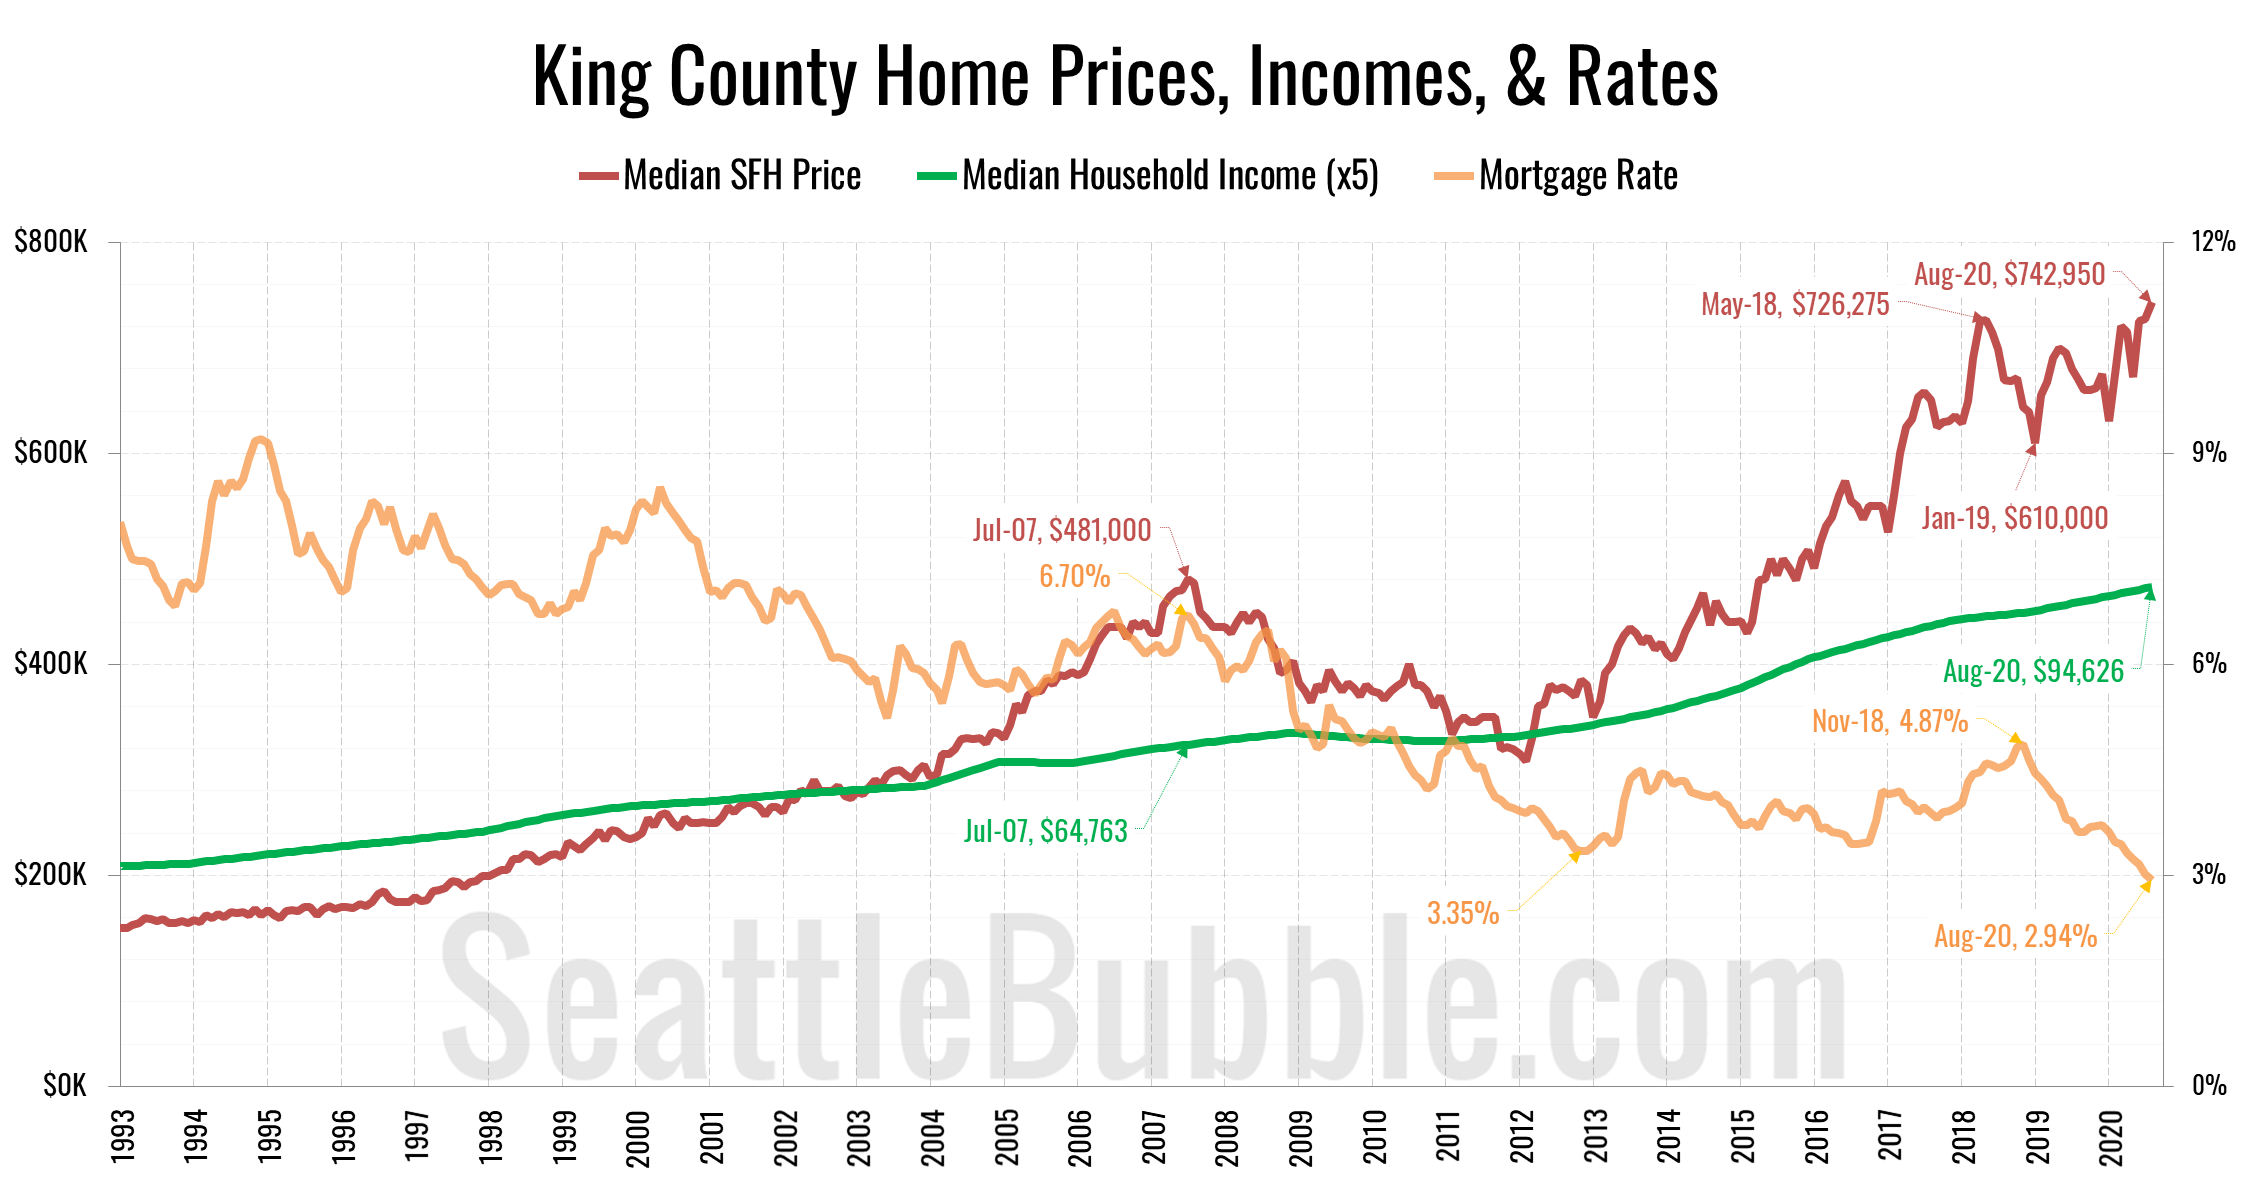
What’s interesting to me is how sharply the affordability index shifted from a rapid decline through most of 2017 and early 2018 to a sharp increase between early 2018 and today. To try to unpack this, let’s look at the individual components that make up the affordability index: home prices, incomes, and interest rates.
In 2017 and early 2018, home prices shot up rapidly, cratering the affordability index. After peaking in May (earlier than usual), home prices fell pretty dramatically over the following eight months, shaving off 16 percent by January of 2019. In fact, it looked a lot like another home price bubble may have been bursting in Seattle.
However, just as these price declines were beginning to gain steam, mortgage rates began dropping like a rock, falling from 4.87% in November 2018 to an inconceivable 2.94% as of August. It sure looks to me like this sudden shift in mortgage rates put the brakes on declining home prices in the Seattle area, and are probably solely responsible for the price increases we have seen over the past year and a half.
Obviously nothing happens in a vacuum, and there are myriad other factors at play here too, but the near-perfect synchronization of the sudden shift in the home price chart and the mortgage rates chart is difficult to ignore.
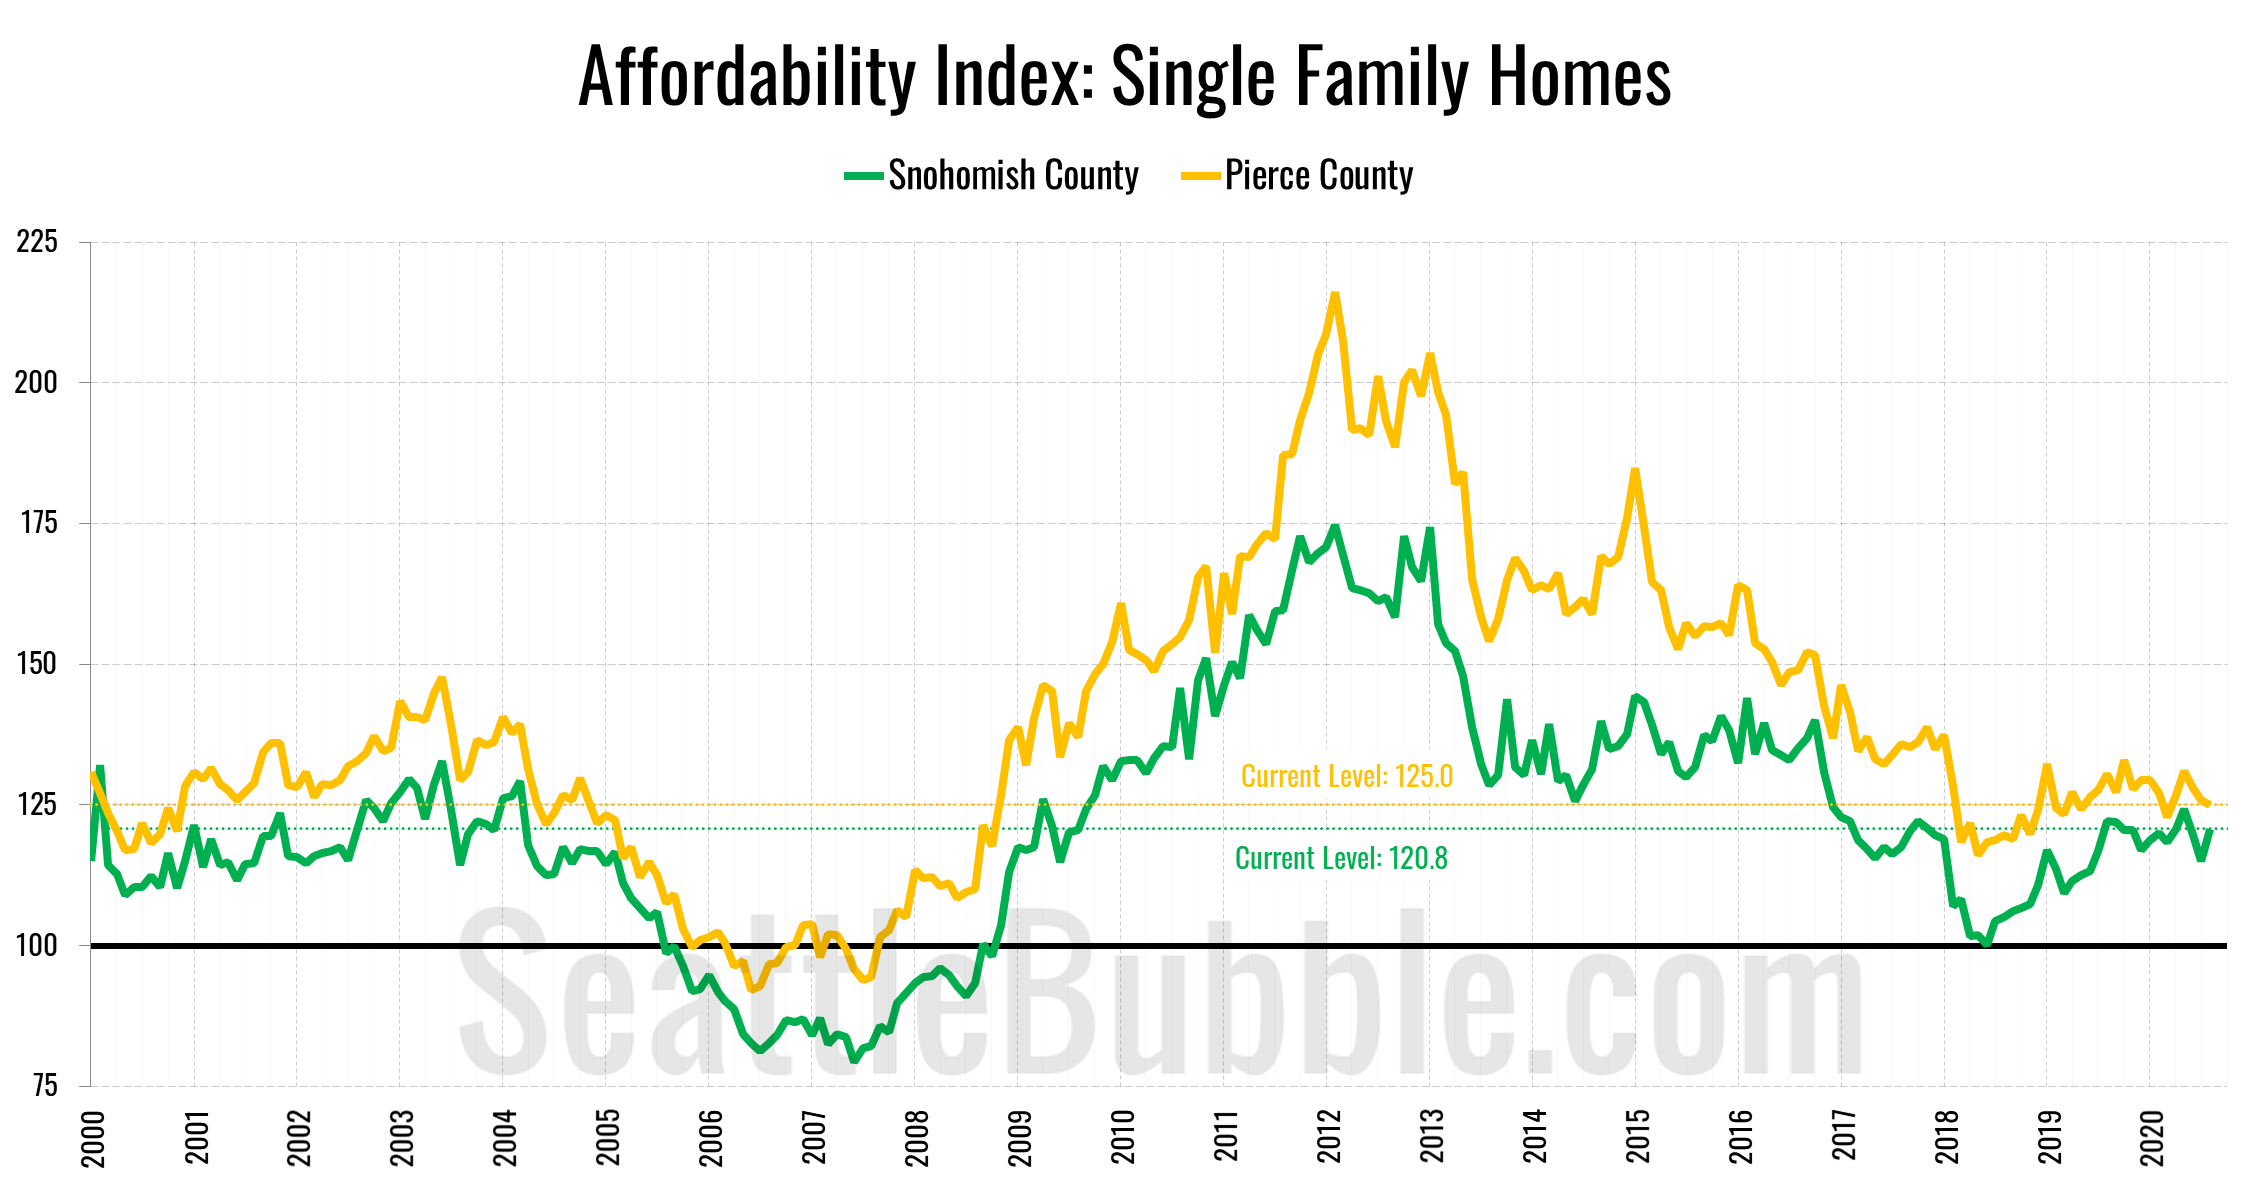
Anyway, here’s a look at the affordability index for Snohomish County and Pierce County since 2000, which have seen similar improvements in affordability driven almost entirely by declining mortage rates:
The affordability index in Snohomish currently sits at 120.8, while Pierce County is at 125.0. Both up considerably from their 2018 low points, and at levels comparable to 2008 or 2009.
You can calculate whether a home purchase scenario is “affordable” using the Affordability Index measure with my simple affordability calculator.
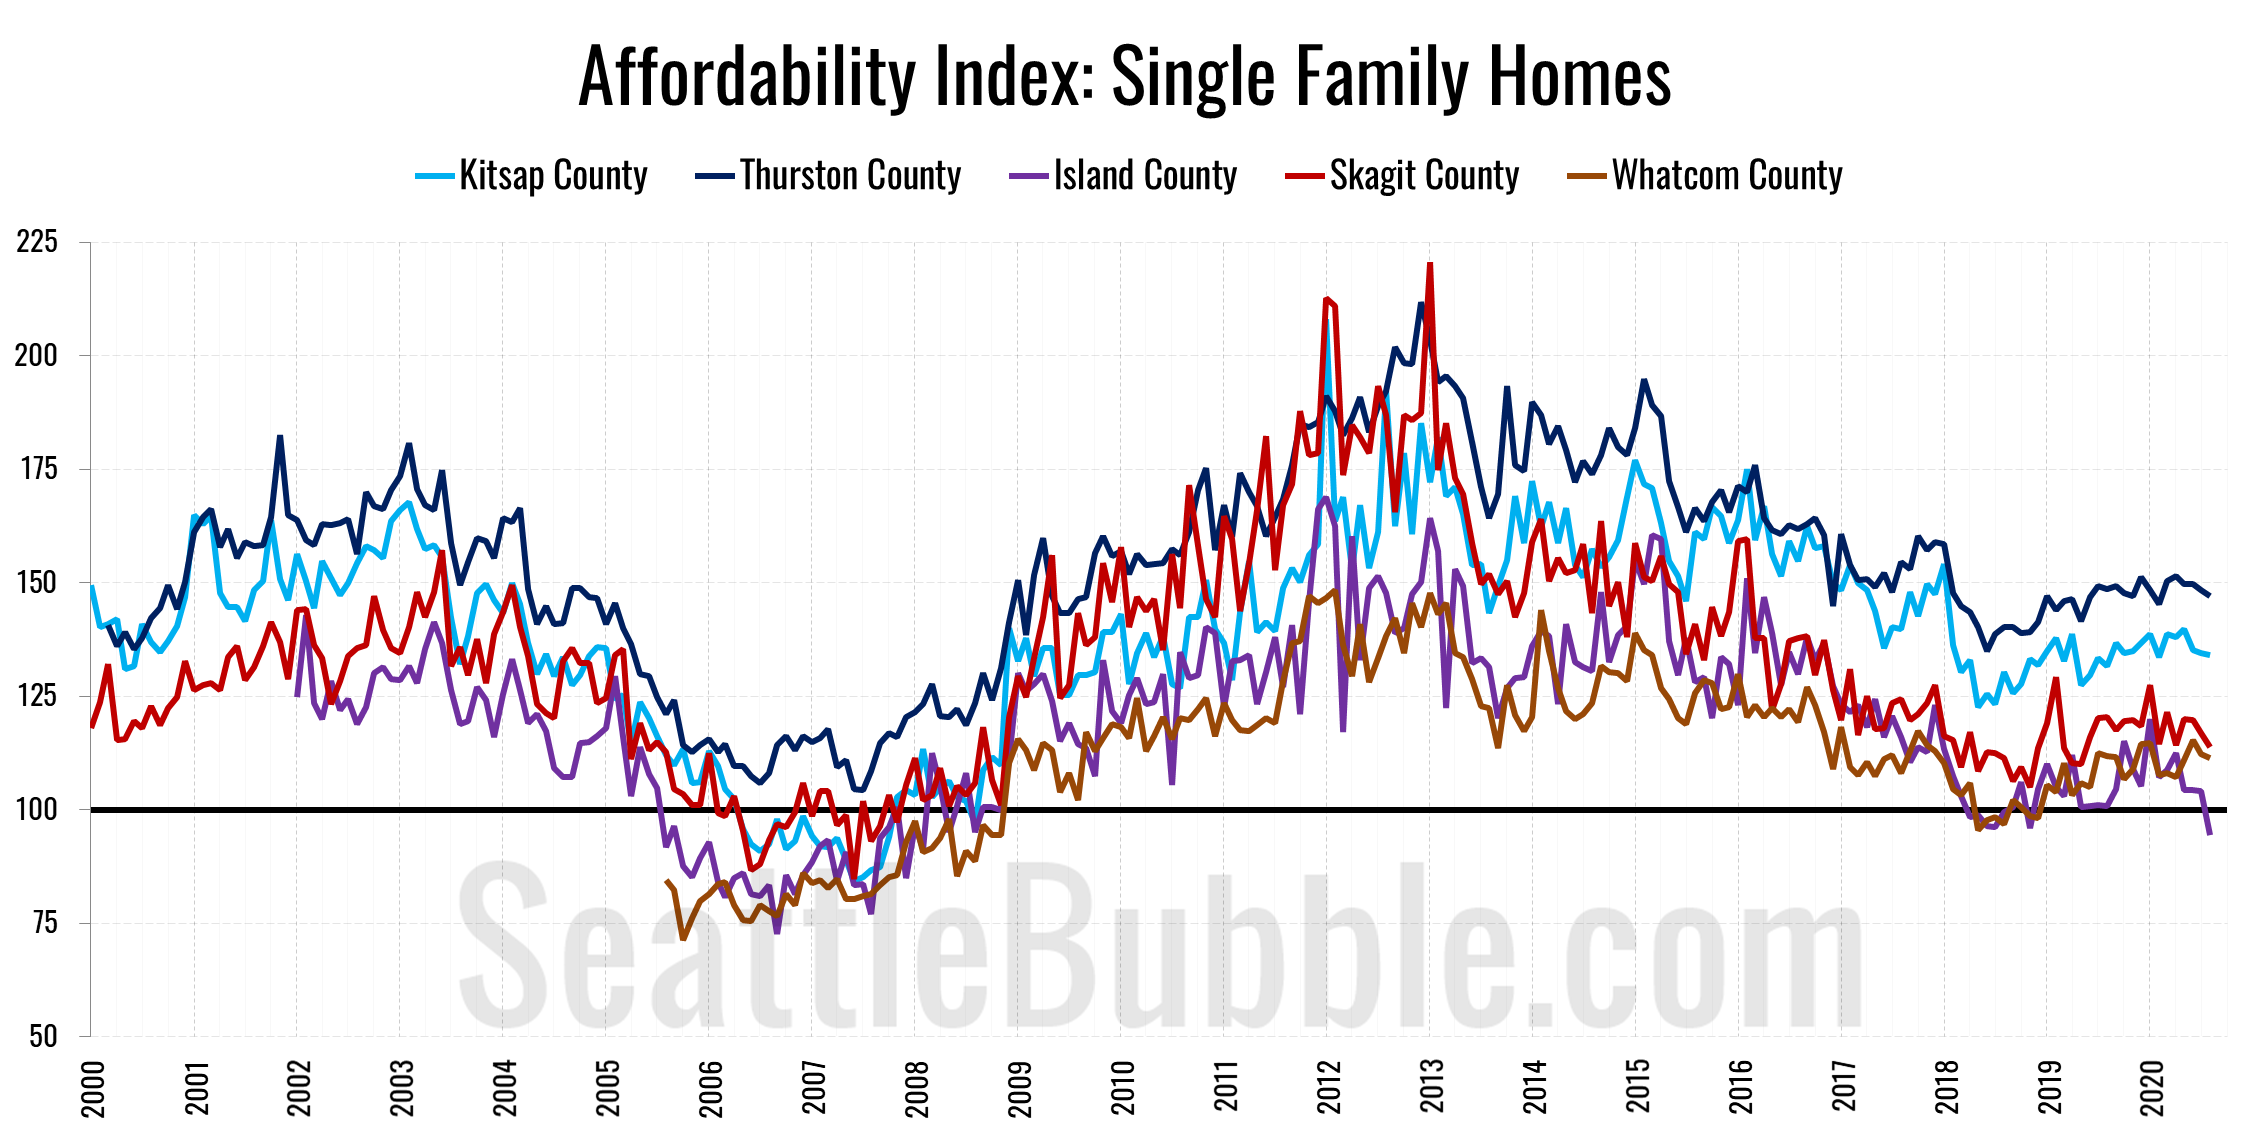
Next week I’ll post updated versions of my charts of the “affordable” home price and income required to afford the median-priced home. Hit the jump for the affordability index methodology, as well as a bonus chart of the affordability index in the outlying Puget Sound counties.
As a reminder, the affordability index is based on three factors: median single-family home price as reported by the NWMLS, 30-year monthly mortgage rates as reported by the Freddie Mac, and estimated median household income as reported by the Washington State Office of Financial Management.
The historic standard for “affordable” housing is that monthly costs do not exceed 30% of one’s income. Therefore, the formula for the affordability index is as follows:
For a more detailed examination of what the affordability index is and what it isn’t, I invite you to read this 2009 post. Or, to calculate your the affordability of your own specific income and home price scenario, check out my Affordability Calculator.


