A reader emailed me to ask if I have “seen a bump in inventory” in the last few weeks. Unfortunately, I haven’t. Here’s a look at new listings by week since the beginning of the year, with last year plotted for comparison: The number of new listings each week did bump up a bit between…
Category: Counties
County-wide statistics.
Case-Shiller Tiers: Low Tier Drags Seattle Index Down
Let’s check out the three price tiers for the Seattle area, as measured by Case-Shiller. Remember, Case-Shiller’s “Seattle” data is based on single-family home repeat sales in King, Pierce, and Snohomish counties. Note that the tiers are determined by sale volume. In other words, 1/3 of all sales fall into each tier. For more details…
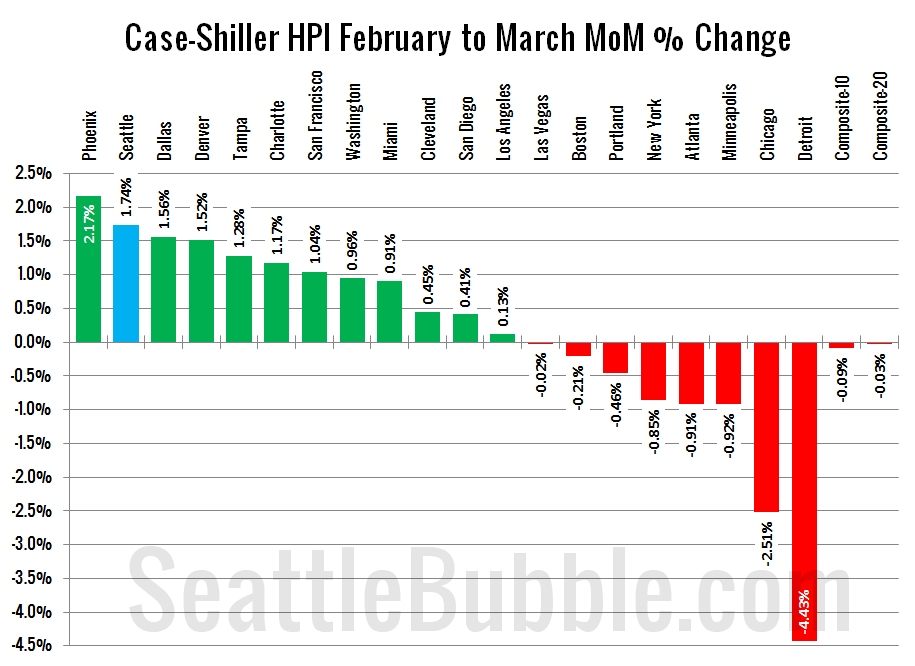
Case-Shiller: Home Prices Hit Predictable Spring Bounce
Let’s have a look at the latest data from the Case-Shiller Home Price Index. According to March data, Seattle-area home prices were: Up 1.7% February to March. Down 1.3% YOY. Down 31.8% from the July 2007 peak Last year prices rose 0.1% from February to March and year-over-year prices were down 7.5%. I stand by…
The Mega Spring Bounce of 2012
In order to quantify just how absurd this year’s spring bounce has been, here are a few charts I generated from the single-family home data on Redfin’s region page for King County: Listings continue to drop through the floor. The selection this year really is abysmal. Meanwhile, listing prices are soaring through the roof. They…
Foreclosures Dip in April, Continue Yearly Drop
It’s time once again to expand on our preview of foreclosure activity with a more detailed look at April’s stats in King, Snohomish, and Pierce counties. First up, the Notice of Trustee Sale summary: April 2012 King: 441 NTS, down 51.6% YOY Snohomish: 275 NTS, down 49.7% YOY Pierce: 267 NTS, down 55.6% YOY Slightly…