Skip to content

Seattle Bubble

local real estate news, statistics, and commentary without the sales spin.

Menu
  • Home
  • About
  • Contact
  • Reference
  • Speaking
Menu

Category: Counties

County-wide statistics.

Second Derivative Suggests Imminent Price Stabilization

Posted on March 8, 2012 by The Tim

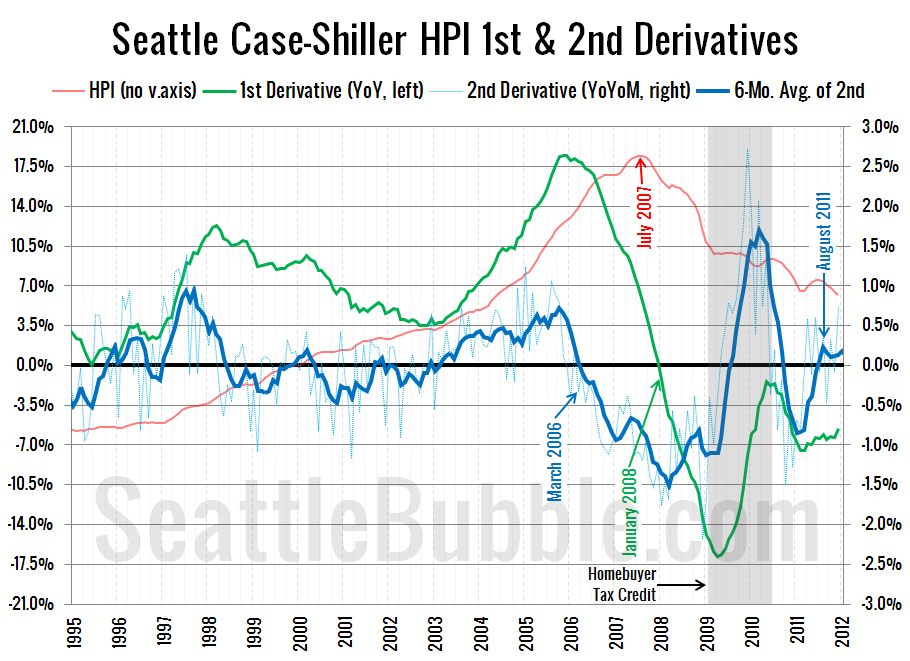
At the risk of getting a little too technical and going off the quant deep end, I wanted to explore a different view of the Case-Shiller home price data that I haven’t shared on here before. Typically when we look at the Case-Shiller home price data on here, we look at three things: The raw…

Share:

  • Twitter
  • LinkedIn
  • Facebook
  • Reddit
  • Pinterest
  • Email

NWMLS: Inventory Shrinks, Sales Climb, Bleeding Slows

Posted on March 5, 2012March 5, 2012 by The Tim

February market stats have been compiled by the NWMLS. Their press release isn’t up yet, but you can read it here once they do publish it. Since we don’t have any amusing prose to poke at, we’ll just dive right into the stats and save the response to their salesmanship for tomorrow’s Reporting Roundup. CAUTION…

Share:

  • Twitter
  • LinkedIn
  • Facebook
  • Reddit
  • Pinterest
  • Email

February Stats Preview: Surprise Sales Spike Edition?

Posted on March 1, 2012March 1, 2012 by The Tim

With another leap day behind us, it’s time to take an early look at February’s stats. Most of the charts below are based on broad county-wide data that is available through a simple search of King County and Snohomish County public records. If you have additional stats you’d like to see in the preview, drop…

Share:

  • Twitter
  • LinkedIn
  • Facebook
  • Reddit
  • Pinterest
  • Email

Case-Shiller Tiers: All Three Tiers Fell Again in December

Posted on February 29, 2012February 28, 2012 by The Tim

Let’s check out the three price tiers for the Seattle area, as measured by Case-Shiller. Remember, Case-Shiller’s “Seattle” data is based on single-family home repeat sales in King, Pierce, and Snohomish counties. Note that the tiers are determined by sale volume. In other words, 1/3 of all sales fall into each tier. For more details…

Share:

  • Twitter
  • LinkedIn
  • Facebook
  • Reddit
  • Pinterest
  • Email

Case-Shiller: 2011 Heads Out with a Fizzle

Posted on February 28, 2012 by The Tim

Let’s have a look at the latest data from the Case-Shiller Home Price Index. According to December data, Seattle-area home prices were: Down 1.3% November to December. Down 5.6% YOY. Down 31.9% from the July 2007 peak Last year prices fell 2.0% from November to December and year-over-year prices were down 6.0%. Still nothing too…

Share:

  • Twitter
  • LinkedIn
  • Facebook
  • Reddit
  • Pinterest
  • Email

Posts navigation

  • Previous
  • 1
  • …
  • 104
  • 105
  • 106
  • 107
  • 108
  • 109
  • 110
  • …
  • 145
  • Next

Tim’s Other Projects

Dispatches from the Multiverse

Tip Jar

Like what we're doing?

Drop us a tip!

Accounts

  • Log in
  • Entries feed
  • Comments feed
  • WordPress.org
©2024 Seattle Bubble | Built using WordPress and Responsive Blogily theme by Superb