Skip to content

Seattle Bubble

local real estate news, statistics, and commentary without the sales spin.

Menu
  • Home
  • About
  • Contact
  • Reference
  • Speaking
Menu

Category: Counties

County-wide statistics.

Case-Shiller Tiers: Rate of Home Price Growth Slows Slightly

Posted on October 26, 2016October 26, 2016 by The Tim

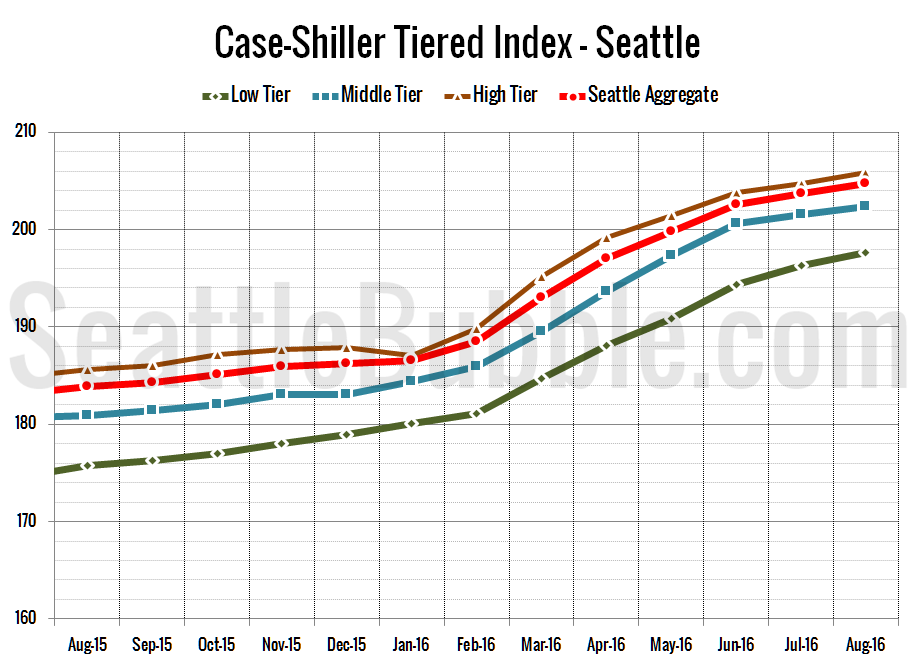
Let’s check out the three price tiers for the Seattle area, as measured by Case-Shiller. Remember, Case-Shiller’s “Seattle” data is based on single-family home repeat sales in King, Pierce, and Snohomish counties.

All three tiers are up month-over-month, but the rate of increase is slowing for the low and middle tiers.

Between July and August, the low tier increased 0.7 percent, the middle tier rose 0.4 percent, and the high tier was up 0.5 percent.
Share:

  • Twitter
  • LinkedIn
  • Facebook
  • Reddit
  • Pinterest
  • Email

Case-Shiller: Upward Summer Slog Continued in August

Posted on October 25, 2016October 26, 2016 by The Tim

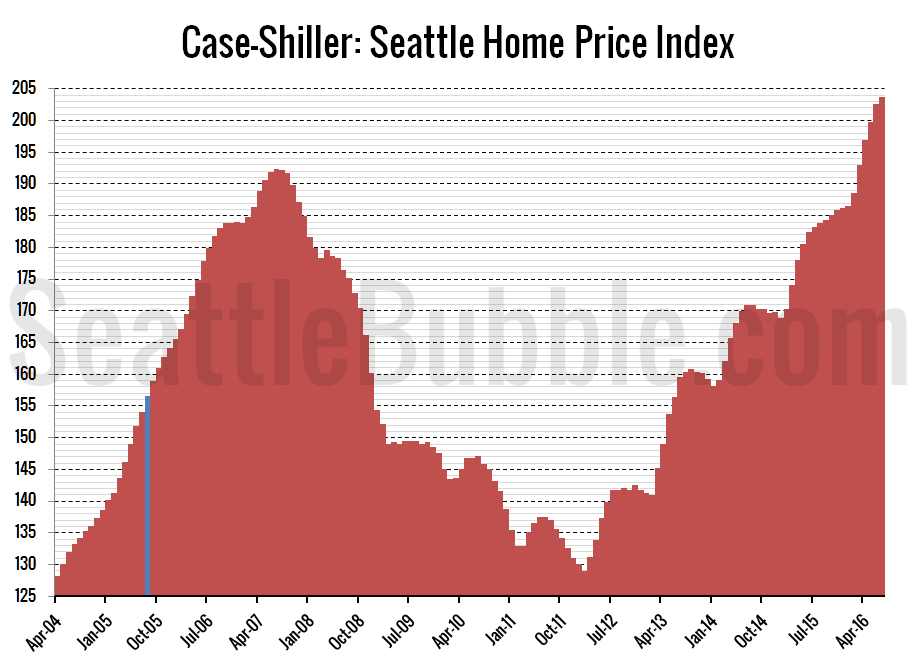
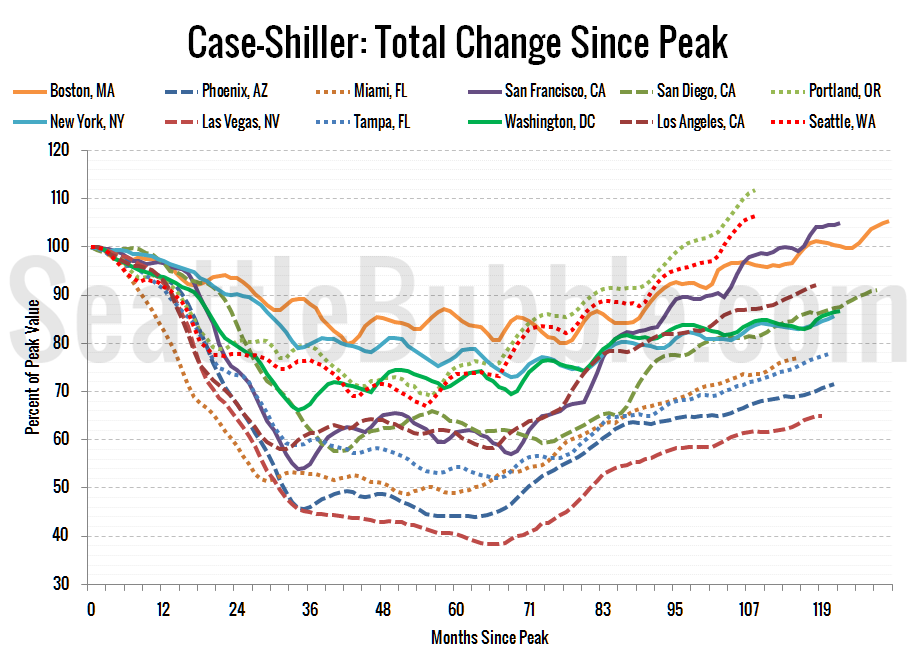
Let’s have a look at the latest data from the Case-Shiller Home Price Index. According to August data that was released this morning, Seattle-area home prices were:

Up 0.5 percent July to August
Up 11.4 percent YOY.
Up 6.5 percent from the July 2007 peak

Over the same period last year prices were up 0.3 percent month-over-month and year-over-year prices were up 7.6 percent.

Surprising no one, Seattle home prices as measured by Case-Shiller hit another new all-time high in August.

Share:

  • Twitter
  • LinkedIn
  • Facebook
  • Reddit
  • Pinterest
  • Email

NWMLS: Listings Up, Prices Down August To September

Posted on October 5, 2016October 6, 2016 by The Tim

September market stats were published by the NWMLS today. The NWMLS press release has not been published yet, so we’ll take a look at that tomorrow.

After a month when everything was moving in sellers’ favor, September was much more of a mixed bag. Listings saw their largest year-over-year increase since May 2014, pushing months of supply up slightly as pending and closed sales both fell from August…

Share:

  • Twitter
  • LinkedIn
  • Facebook
  • Reddit
  • Pinterest
  • Email

September Stats Preview: A Late-Summer Listings Bump

Posted on October 3, 2016October 6, 2016 by The Tim

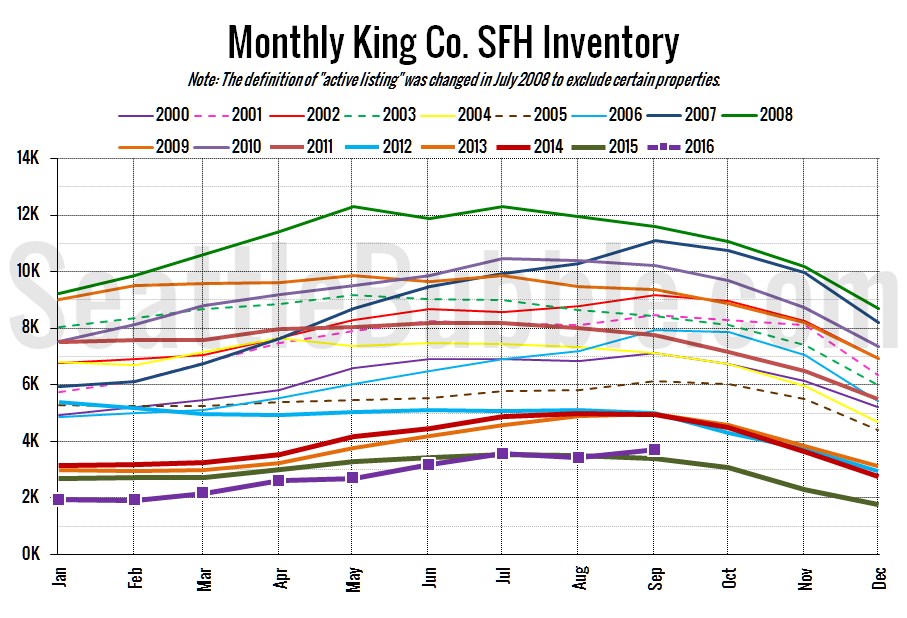
September brought some good-ish news for potential homebuyers. During a time of year that the number of homes on the market typically begins to decline, King County and Snohomish County each saw listings increase slightly from the previous month. We’re still far from a buyer’s market, but it’s a bit of a surprising turn.

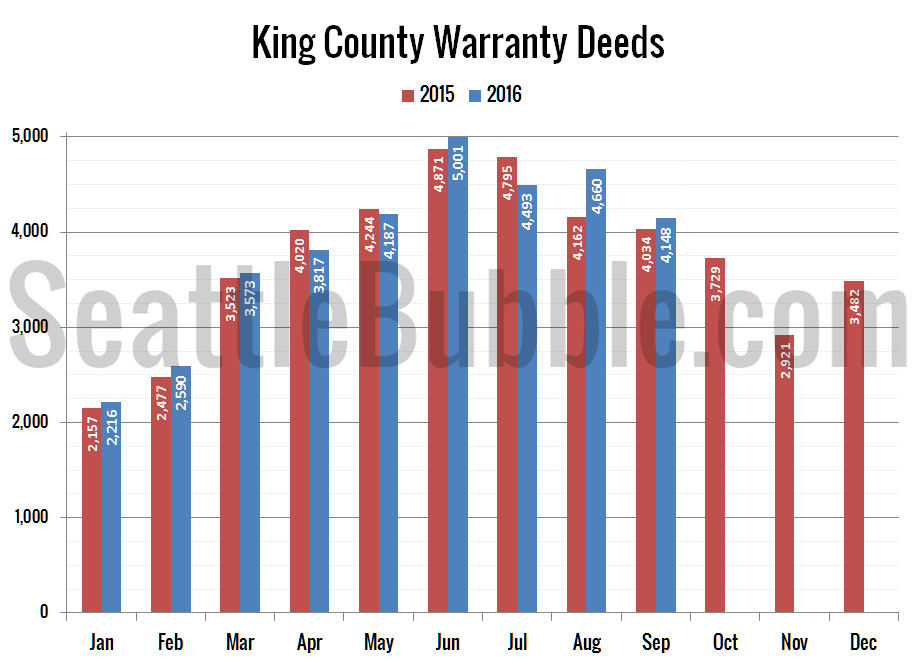
While inventory increased slightly, sales still came in strong, beating last year’s September levels in both counties but sharply declining from August. Foreclosures also remain near their all-time low levels…

Share:

  • Twitter
  • LinkedIn
  • Facebook
  • Reddit
  • Pinterest
  • Email

Case-Shiller: Seattle Home Prices Inched Up In July

Posted on September 27, 2016October 6, 2016 by The Tim

Let’s have a look at the latest data from the Case-Shiller Home Price Index. According to July data that was released this morning, Seattle-area home prices were:

Up 0.6 percent June to July
Up 11.2 percent YOY.
Up 5.9 percent from the July 2007 peak

Over the same period last year prices were up 0.4 percent month-over-month and year-over-year prices were up 7.2 percent.

The Seattle area’s Case-Shiller home price index hit yet another new all-time high in July, and turned in stronger numbers than a year ago across the board. Again. This matches with the July data we’ve already seen from public records and NWMLS.

Share:

  • Twitter
  • LinkedIn
  • Facebook
  • Reddit
  • Pinterest
  • Email

Posts navigation

  • Previous
  • 1
  • …
  • 20
  • 21
  • 22
  • 23
  • 24
  • 25
  • 26
  • …
  • 145
  • Next

Tim’s Other Projects

Dispatches from the Multiverse

Tip Jar

Like what we're doing?

Drop us a tip!

Accounts

  • Log in
  • Entries feed
  • Comments feed
  • WordPress.org
©2024 Seattle Bubble | Built using WordPress and Responsive Blogily theme by Superb