Skip to content

Seattle Bubble

local real estate news, statistics, and commentary without the sales spin.

Menu
  • Home
  • About
  • Contact
  • Reference
  • Speaking
Menu

Category: Counties

County-wide statistics.

June Stats: Inventory Edges Up Despite Record Sales

Posted on July 1, 2016July 7, 2016 by The Tim

Now that June is behind us, let’s have our first look at how the month’s real estate stats stack up.

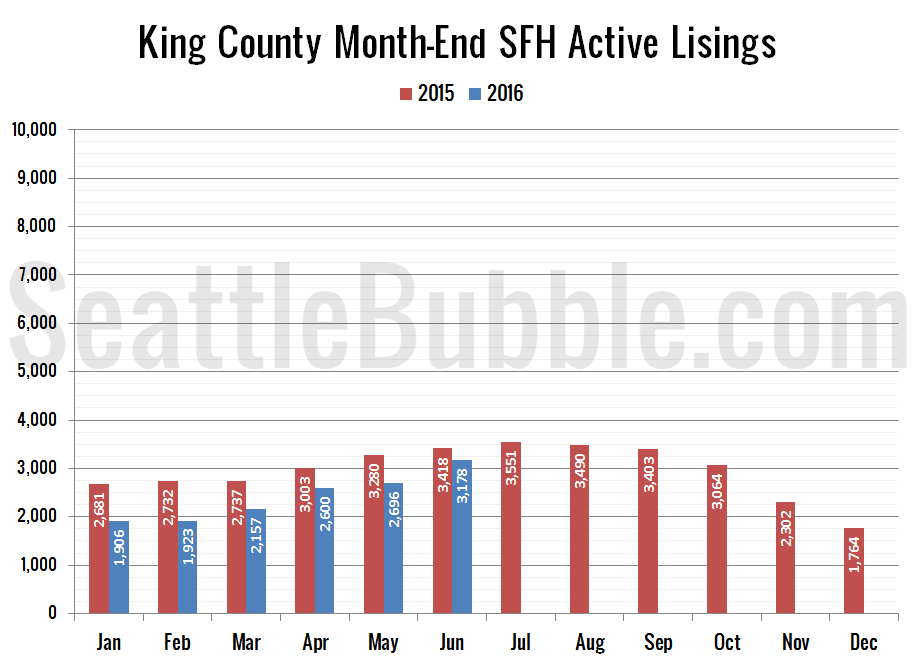
June was a mixed bag. Sales hit their highest level since 2007 in King County and a new all-time high in Snohomish County. Despite this, active listings saw unusually large month-over-month increases in both counties. Foreclosures are still at or near lows…

Share:

  • Twitter
  • LinkedIn
  • Facebook
  • Reddit
  • Pinterest
  • Email

Case-Shiller Tiers: Only Low Tier Still Below Previous Peak

Posted on June 29, 2016July 7, 2016 by The Tim

Let’s check out the three price tiers for the Seattle area, as measured by Case-Shiller.

Between March and April, the low tier increased 1.9 percent, the middle tier rose 2.2 percent, and the high tier was up 2.0 percent.

Share:

  • Twitter
  • LinkedIn
  • Facebook
  • Reddit
  • Pinterest
  • Email

Case-Shiller: Seattle Price Gains Biggest In Nation Again

Posted on June 28, 2016July 7, 2016 by The Tim

Let’s have a look at the latest data from the Case-Shiller Home Price Index. According to January data that was released today, Seattle-area home prices were:

Up 2.1 percent March to April
Up 10.7 percent YOY.
Up 2.5 percent from the July 2007 peak

Over the same period last year prices were up 2.2 percent month-over-month and year-over-year prices were up 7.4 percent.

The Seattle area’s Case-Shiller home price index hit another new all-time high in April, and saw the largest month-over-month gain of all twenty Case-Shiller-tracked cities for the second month in a row.

Share:

  • Twitter
  • LinkedIn
  • Facebook
  • Reddit
  • Pinterest
  • Email

Record-High Home Prices Are “Affordable” Thanks To High Incomes and Low Rates

Posted on June 21, 2016July 7, 2016 by The Tim

As promised in yesterday’s affordability post, here’s an updated look at the “affordable home” price chart.

The “affordable” home price hit an all-time high of $551,493 in May, thanks to increasing incomes and decreasing mortgage interest rates. The “affordable” home price of $551,493 in King County would have a monthly payment of $2,006.

If interest rates were at a more reasonable level of 6 percent (which is still quite low by historical standards), the “affordable” home price would be just $382,986—about $103,000 lower than it is today.

Share:

  • Twitter
  • LinkedIn
  • Facebook
  • Reddit
  • Pinterest
  • Email

Low Rates Continue To Prop Up Affordability

Posted on June 20, 2016July 7, 2016 by The Tim

It was recently requested that I take a refreshed look at the affordability stats, so here’s an updated look at our affordability index charts for the counties around Puget Sound.

As of May, affordability is still not great for home buyers, but it would be much, much worse if not for the current absurdly low interest rates.

Share:

  • Twitter
  • LinkedIn
  • Facebook
  • Reddit
  • Pinterest
  • Email

Posts navigation

  • Previous
  • 1
  • …
  • 23
  • 24
  • 25
  • 26
  • 27
  • 28
  • 29
  • …
  • 145
  • Next

Tim’s Other Projects

Dispatches from the Multiverse

Tip Jar

Like what we're doing?

Drop us a tip!

Accounts

  • Log in
  • Entries feed
  • Comments feed
  • WordPress.org
©2024 Seattle Bubble | Built using WordPress and Responsive Blogily theme by Superb