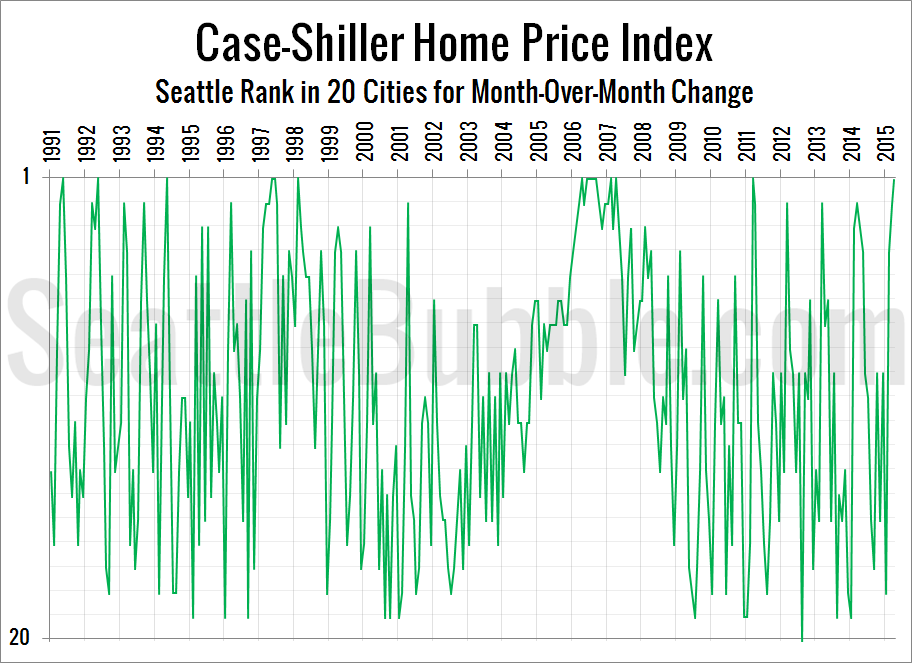
Let’s have a look at the latest data from the Case-Shiller Home Price Index. According to April data, Seattle-area home prices were: Up 2.3% March to April Up 7.5% YOY. Down 7.4% from the July 2007 peak Last year at this time prices rose 2.3% month-over-month and year-over-year prices were up 11.2%. Year-over-year and month-over-month…
Category: Counties
County-wide statistics.
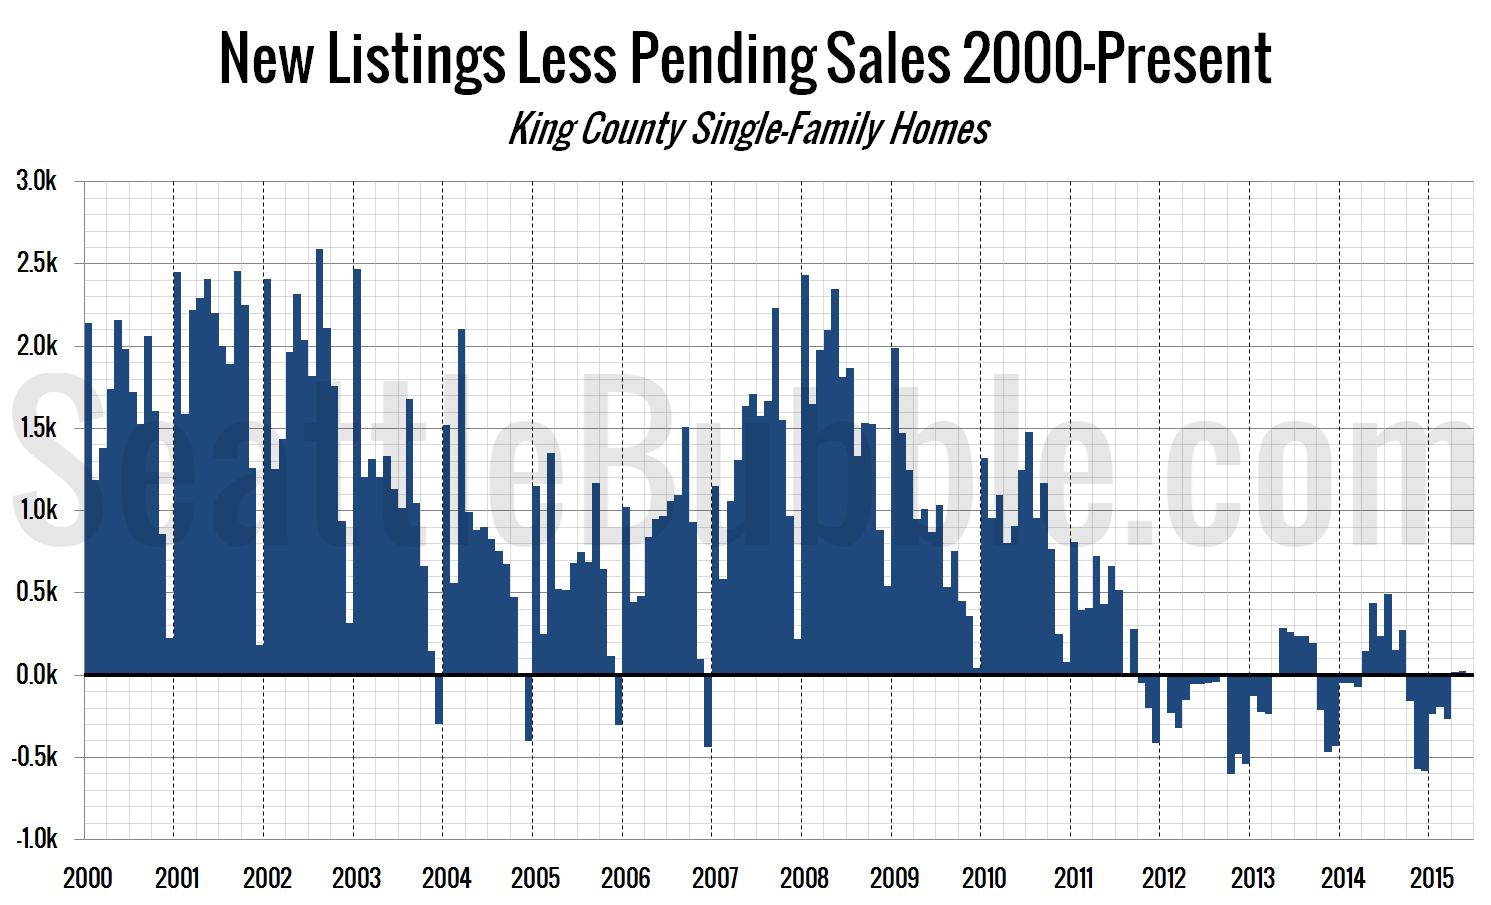
Most New Listings Being Immediately Snatched Up
A recent commenter had some questions about inventory: …how much of the “low inventory” story is really a story of “high churn”? …it doesn’t seem like there is really a shortage of inventory, but rather that there is a shortage of stale inventory. Would be really curious to see how how new listing rates for…
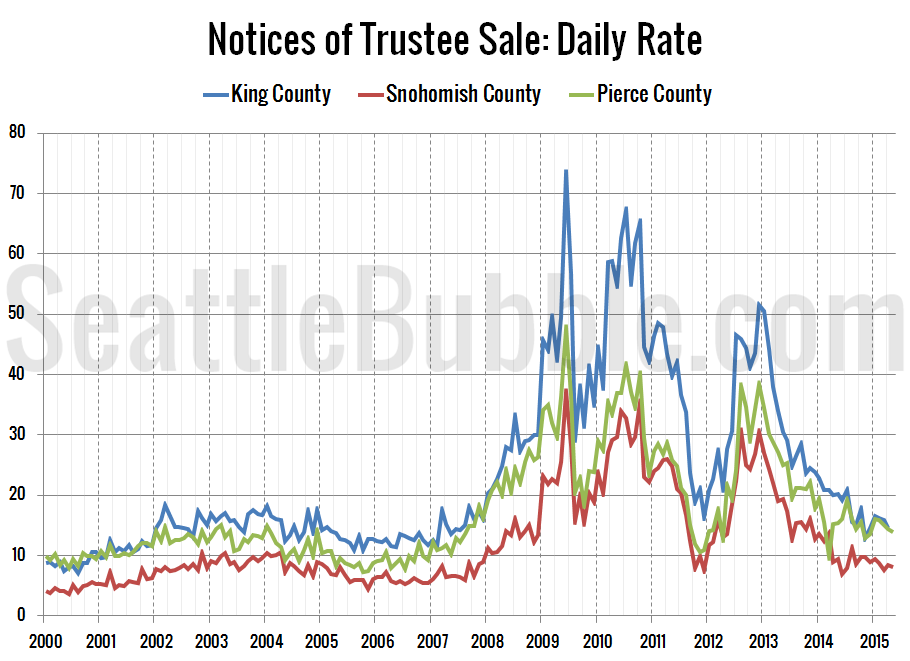
Foreclosure Levels Still Just Barely Above Pre-Bust Years
It’s been a few months since we took a detailed look at foreclosure stats in King, Snohomish, and Pierce counties, so let’s update those numbers. First up, the Notice of Trustee Sale summary: May 2015 King: 306 NTS, down 27% YOY Snohomish: 162 NTS, down 18% YOY Pierce: 279 NTS, down 14% YOY The number…
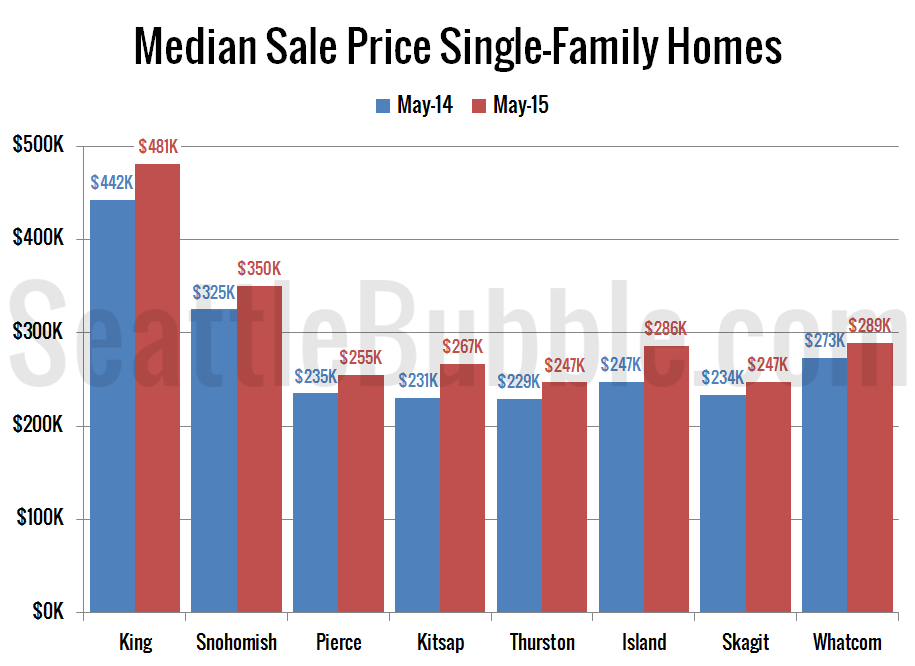
Around the Sound: Misery for Buyers Everywhere
Let’s update our monthly stats for the local regions outside of the King/Snohomish core. Here’s your May update to our “Around the Sound” statistics for Pierce, Kitsap, Thurston, Island, Skagit, and Whatcom counties. Are things any better in the market right now for buyers outside of the core Seattle areas? Unfortunately, not really. It’s still…
NWMLS: Market Goes From Bad to Worse for Buyers
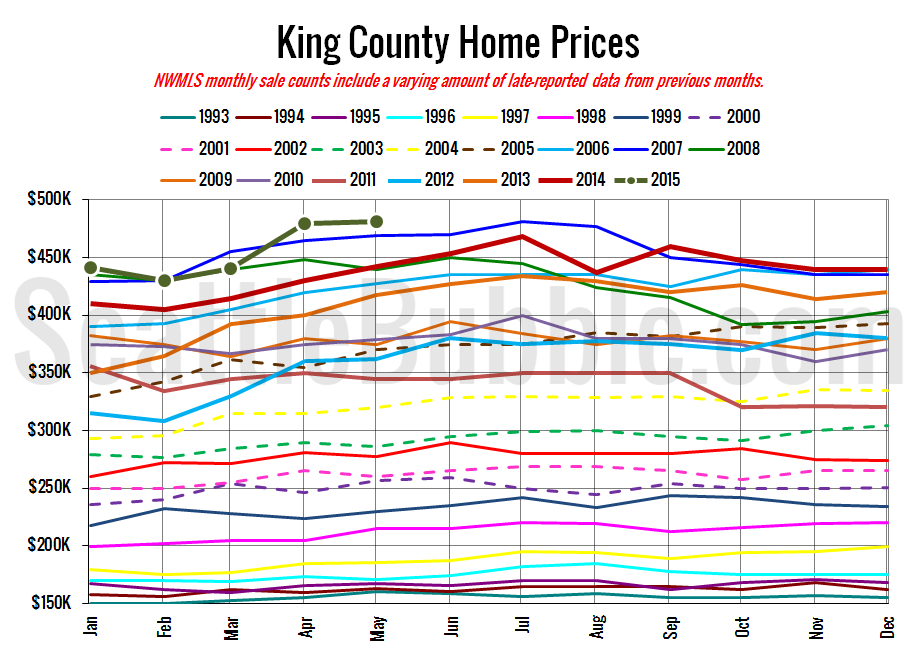
May market stats were published by the NWMLS yesterday. Before we get into our monthly stats, here’s a quick look at their press release. Northwest MLS brokers say home buyers are sprinting, but sellers are stalling Home buyers are in “full sprint” mode while sellers are stalling, according to brokers from Northwest Multiple Listing Service….
