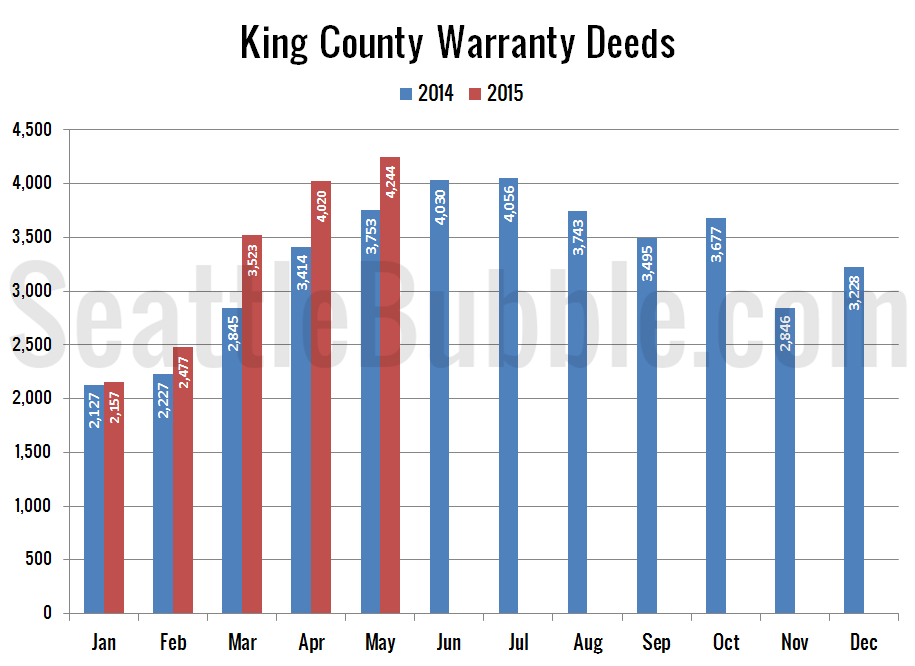
With May 2015 now in the rear view mirror, let’s have a look at our monthly stats preview. First up, here’s the snapshot of all the data as far back as my historical information goes, with the latest, high, and low values highlighted for each series: Inventory went up again month-over-month in both King and…
Category: Counties
County-wide statistics.
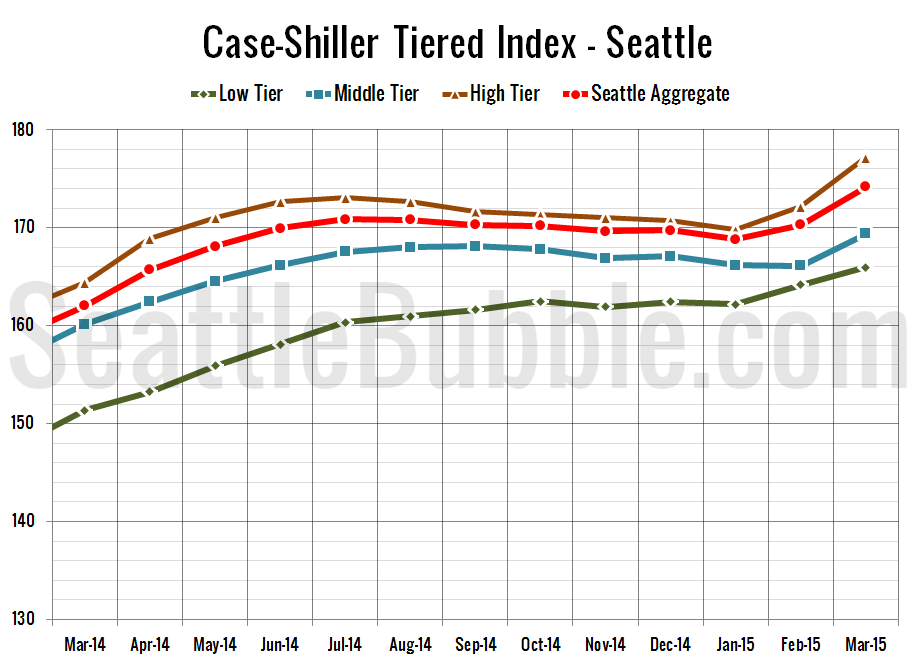
Case-Shiller Tiers: High Tier Prices Shoot Up
Let’s check out the three price tiers for the Seattle area, as measured by Case-Shiller. Remember, Case-Shiller’s “Seattle” data is based on single-family home repeat sales in King, Pierce, and Snohomish counties. Note that the tiers are determined by sale volume. In other words, 1/3 of all sales fall into each tier. For more details…
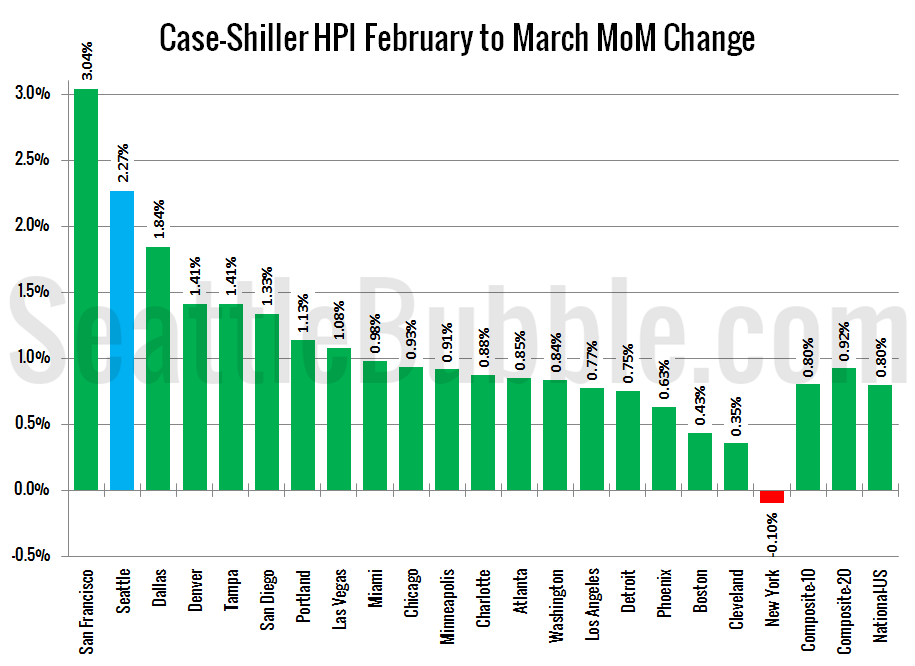
Case-Shiller: Home Prices Shot Up in March
Let’s have a look at the latest data from the Case-Shiller Home Price Index. According to March data, Seattle-area home prices were: Up 2.3% February to March Up 7.5% YOY. Down 9.4% from the July 2007 peak Last year at this time prices rose 1.9% month-over-month and year-over-year prices were up 11.6%. Year-over-year price gains…
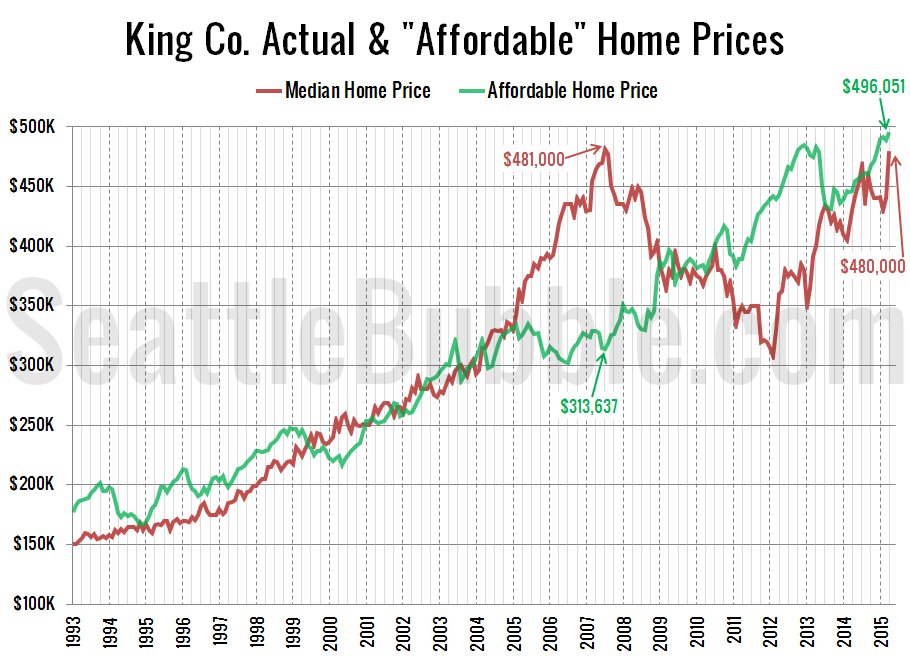
Low Rates Add $120K to the “Affordable” Home Price
As promised in yesterday’s affordability post, here’s an updated look at the “affordable home” price chart. In this graph I flip the variables in the affordability index calculation around to other sides of the equation to calculate what price home the a family earning the median household income could afford to buy at today’s mortgage…
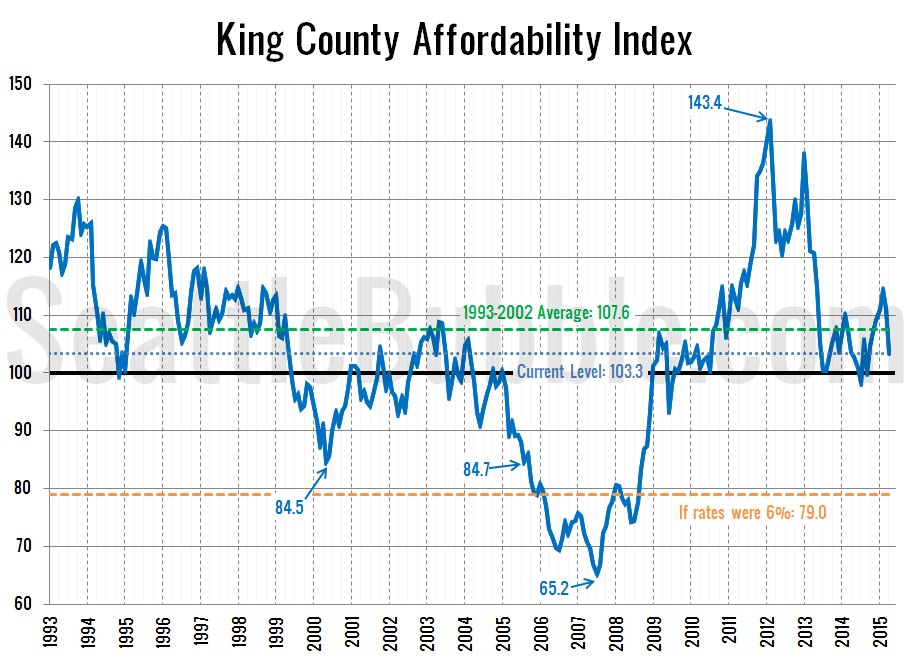
Affordability Index Kept Under Control by Low Rates
A reader pointed out that we haven’t looked at how the affordability index is doing in the Seattle area since late last year. Let’s update our standard charts. So how does affordability look as of April? Despite median home prices shooting up, falling interest rates that are back below 4 percent again have kept the…
