Skip to content

Seattle Bubble

local real estate news, statistics, and commentary without the sales spin.

Menu
  • Home
  • About
  • Contact
  • Reference
  • Speaking
Menu

Category: Counties

County-wide statistics.

Around the Sound: Strong Seller’s Market Everywhere

Posted on May 12, 2015May 13, 2015 by The Tim

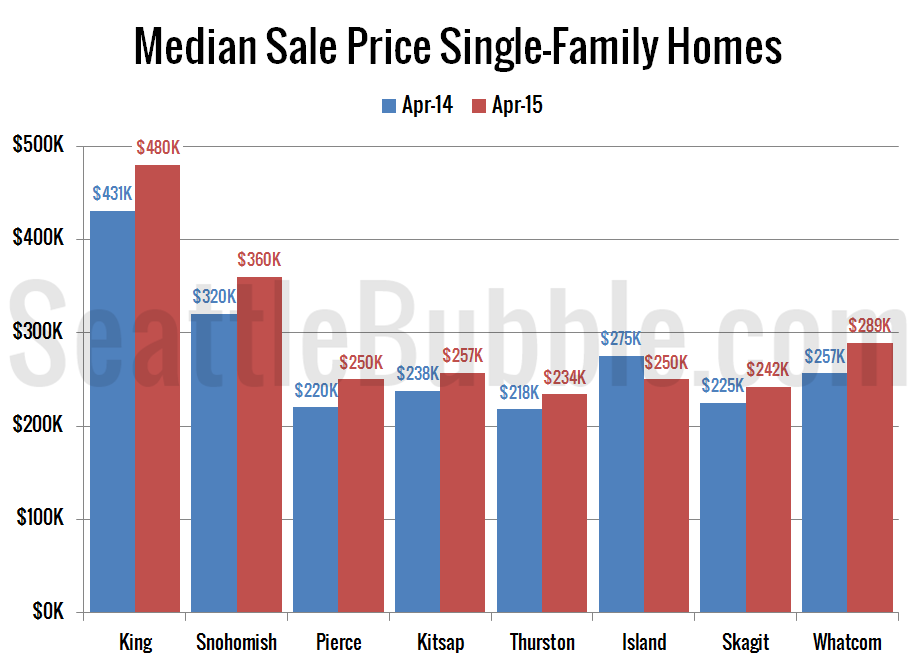
It has been a while since we checked up on stats outside of the King/Snohomish core, so let’s update our “Around the Sound” statistics for Pierce, Kitsap, Thurston, Island, Skagit, and Whatcom counties. This month’s story in a nutshell: Bad news for buyers, great news for sellers. It’s pretty much a terrible time to buy…

Share:

  • Twitter
  • LinkedIn
  • Facebook
  • Reddit
  • Pinterest
  • Email
King County Median Price: Nominal and Real

Median Price May Pass Inflation-Adjusted Peak This Year

Posted on May 8, 2015May 12, 2015 by The Tim

As promised, I’ve updated my chart of nominal and real (inflation-adjusted) King County median single-family home prices with data through April. When adjusting into 2015 dollars, the median price peaked at $527,607 in July 2007. April 2015’s median price of $480,000 comes in about 9 percent below that level, and is roughly comparable to where…

Share:

  • Twitter
  • LinkedIn
  • Facebook
  • Reddit
  • Pinterest
  • Email

NWMLS: King County Home Prices Near Bubble Peak

Posted on May 6, 2015 by The Tim

April market stats were published by the NWMLS yesterday. Before we get into our monthly stats, here’s a quick look at their press release. Pent-up demand triggering record pace of home sales around Western Washington Northwest Multiple Listing Service members notched a record high level of pending sales during April, surpassing the year-ago volume by…

Share:

  • Twitter
  • LinkedIn
  • Facebook
  • Reddit
  • Pinterest
  • Email

April Stats Preview: Surging Sales Edition

Posted on May 1, 2015 by The Tim

With April 2015 now in the rear view mirror, let’s have a look at our monthly stats preview. First up, here’s the snapshot of all the data as far back as my historical information goes, with the latest, high, and low values highlighted for each series: First, a tiny ray of good news… Listing inventory…

Share:

  • Twitter
  • LinkedIn
  • Facebook
  • Reddit
  • Pinterest
  • Email

Case-Shiller Tiers: Low Tier Back to Double-Digit Gains

Posted on April 29, 2015 by The Tim

Let’s check out the three price tiers for the Seattle area, as measured by Case-Shiller. Remember, Case-Shiller’s “Seattle” data is based on single-family home repeat sales in King, Pierce, and Snohomish counties. Note that the tiers are determined by sale volume. In other words, 1/3 of all sales fall into each tier. For more details…

Share:

  • Twitter
  • LinkedIn
  • Facebook
  • Reddit
  • Pinterest
  • Email

Posts navigation

  • Previous
  • 1
  • …
  • 37
  • 38
  • 39
  • 40
  • 41
  • 42
  • 43
  • …
  • 145
  • Next

Tim’s Other Projects

Dispatches from the Multiverse

Tip Jar

Like what we're doing?

Drop us a tip!

Accounts

  • Log in
  • Entries feed
  • Comments feed
  • WordPress.org
©2024 Seattle Bubble | Built using WordPress and Responsive Blogily theme by Superb