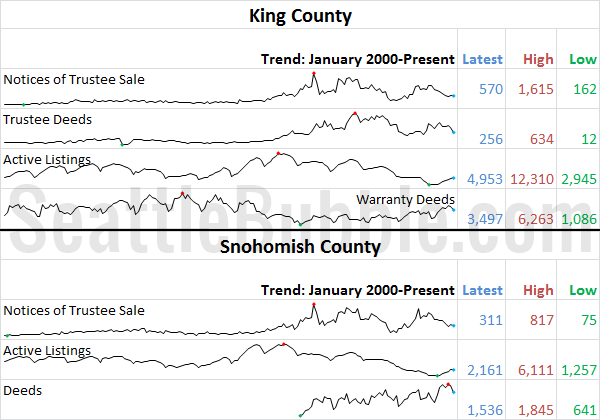
It’s time for us to check up on stats outside of the King/Snohomish core with our “Around the Sound” statistics. If there is certain data you would like to see or ways you would like to see the data presented differently, drop a comment below and let me know. First up, a summary table: September…
Category: Counties
County-wide statistics.
Listing Growth in 2013 Largest Since 2007
Let’s have a look at how listings are doing over the last few months. First up, here’s a view of how inventory has grown so far this year: Since 2013 started at a record-low level of homes on the market, inventory growth this year has been the largest since 2007, and the third-largest of any…
Seattle-Area Foreclosures Fell Again in September
It’s time for our detailed look at September’s foreclosure stats in King, Snohomish, and Pierce counties. First up, the Notice of Trustee Sale summary: September 2013 King: 570 NTS, down 32% YOY Snohomish: 311 NTS, down 34% YOY Pierce: 425 NTS, down 35% YOY The number of trustee sale notices decreased month-over-month in all three…
NWMLS: Inventory Up, Home Sales & Prices Down
They have not yet published the press release to their website, but September market stats are now available from the NWMLS. Once they post a press release I’ll update this post with a brief snippet. Until then, let’s just go straight to the stats. CAUTION NWMLS monthly reports include an undisclosed and varying number ofsales…
September Stats Preview: One More Inventory Bump Edition
With the month of September now in the history books, let’s have a look at our stats preview. Most of the charts below are based on broad county-wide data that is available through a simple search of King County and Snohomish County public records. If you have additional stats you’d like to see in the…