Skip to content

Seattle Bubble

local real estate news, statistics, and commentary without the sales spin.

Menu
  • Home
  • About
  • Contact
  • Reference
  • Speaking
Menu

Category: Counties

County-wide statistics.

2013 Real Estate Commissions On Par with Pre-Bubble Years

Posted on July 22, 2013July 22, 2013 by The Tim

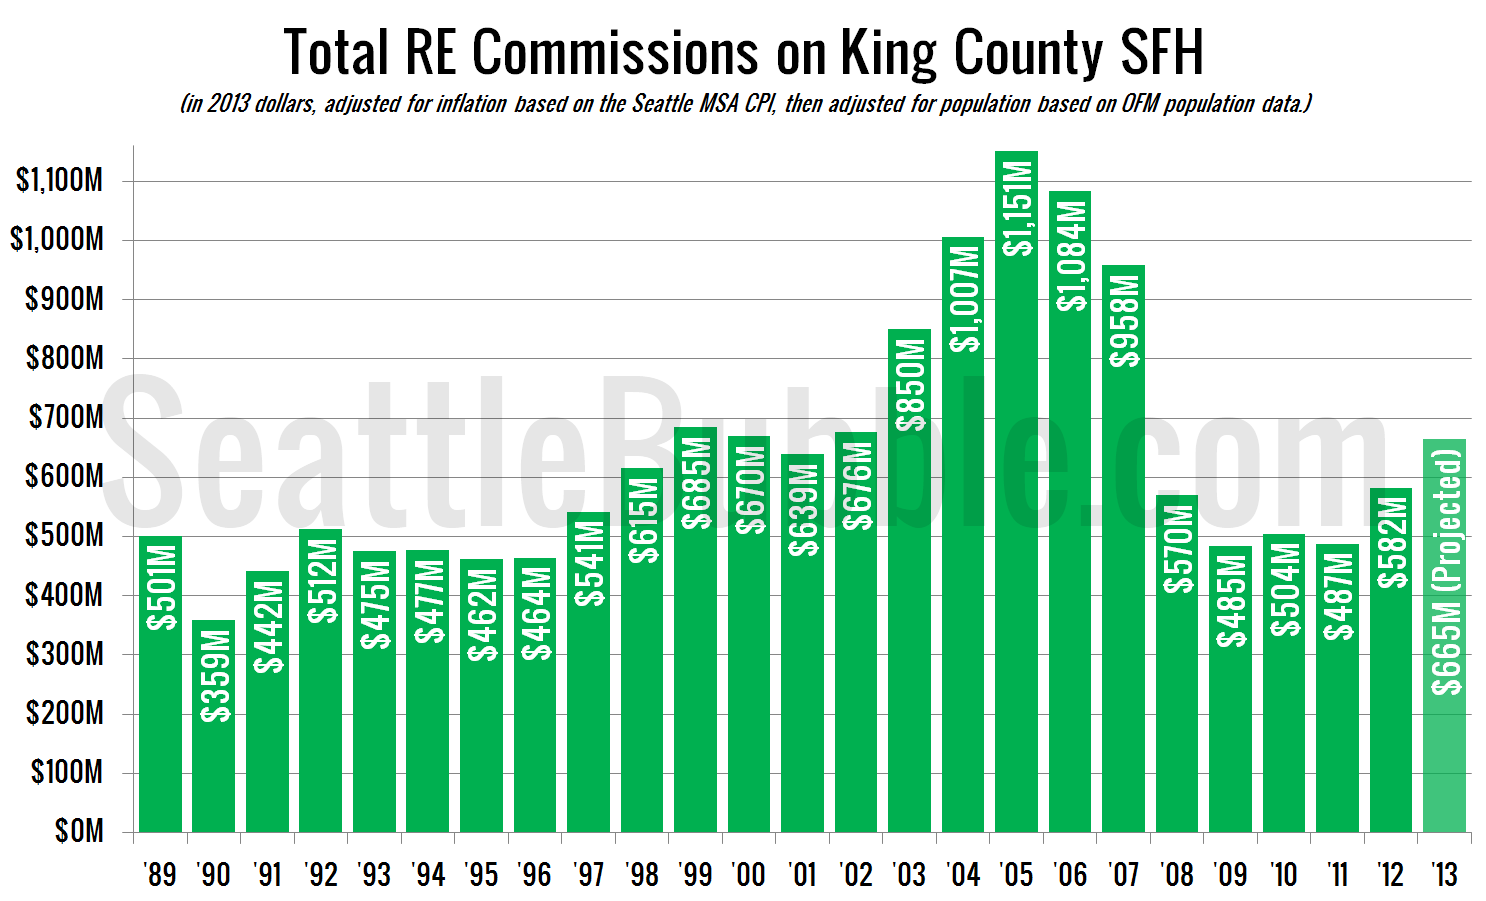
It’s been a year and a half since we looked at how real estate commissions are faring—well past time for an update. For these charts I have estimated the total commissions for 2013 based on the sales volume and prices for the first half of the year. The final numbers will no doubt be slightly…

Share:

  • Twitter
  • LinkedIn
  • Facebook
  • Reddit
  • Pinterest
  • Email

Seattle Monthly Job Growth Hits 13-Year High in June

Posted on July 19, 2013July 19, 2013 by The Tim

New local job stats came out this week, so let’s have a look at the Seattle area’s employment situation. First up, year-over-year job growth, broken down into a few relevant sectors: Since things are getting really jumbled together lately on that chart, I broke down just the last year and zoomed in so you can…

Share:

  • Twitter
  • LinkedIn
  • Facebook
  • Reddit
  • Pinterest
  • Email

Inventory Growth in 2013 is the Strongest Since 2008

Posted on July 17, 2013 by The Tim

Although total active inventory is still near record lows, here’s some good news: inventory growth so far in 2013 is the best we’ve seen since 2008: As of the end of June there were 42.72% more listings on the market than there were at the beginning of the year. That just barely edges out the…

Share:

  • Twitter
  • LinkedIn
  • Facebook
  • Reddit
  • Pinterest
  • Email

Non-Distressed Median Price Surged Again in June

Posted on July 12, 2013July 12, 2013 by The Tim

As promised earlier this week, it’s time to check up on median home sale prices broken down by distress status: Non-distressed, bank-owned, and short sales. As of June, the non-distressed median price for King County single family home sales sits at $460,000, up 7.0% from a year earlier and up 4.3% from May. Last year…

Share:

  • Twitter
  • LinkedIn
  • Facebook
  • Reddit
  • Pinterest
  • Email

Foreclosures Fall Below 2012 Levels in King & Snohomish

Posted on July 11, 2013July 11, 2013 by The Tim

It’s time for our detailed look at June’s foreclosure stats in King, Snohomish, and Pierce counties. First up, the Notice of Trustee Sale summary: June 2013 King: 584 NTS, down 9% YOY Snohomish: 349 NTS, down 10% YOY Pierce: 506 NTS, up 24% YOY Just as predicted, we’ve started to flip to year-over-year declines. This…

Share:

  • Twitter
  • LinkedIn
  • Facebook
  • Reddit
  • Pinterest
  • Email

Posts navigation

  • Previous
  • 1
  • …
  • 72
  • 73
  • 74
  • 75
  • 76
  • 77
  • 78
  • …
  • 145
  • Next

Tim’s Other Projects

Dispatches from the Multiverse

Tip Jar

Like what we're doing?

Drop us a tip!

Accounts

  • Log in
  • Entries feed
  • Comments feed
  • WordPress.org
©2024 Seattle Bubble | Built using WordPress and Responsive Blogily theme by Superb