Skip to content

Seattle Bubble

local real estate news, statistics, and commentary without the sales spin.

Menu
  • Home
  • About
  • Contact
  • Reference
  • Speaking
Menu

Category: Counties

County-wide statistics.

Distressed Sales Tumbled in March

Posted on April 10, 2013 by The Tim

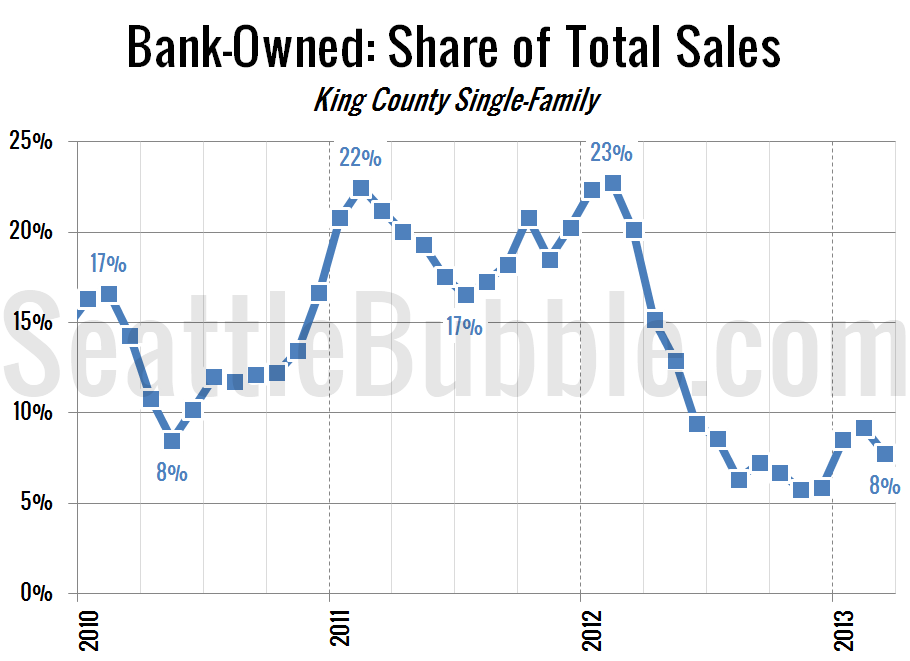
Let’s take another look at what share of the monthly sales are being distressed sales—bank-owned and short sales. In March 2012 20.1% of the sales of single-family homes in King County were bank-owned, just a few points below the highest level on record. In March 2013 that number was just 7.7%. As predicted, after bumping…

Share:

  • Twitter
  • LinkedIn
  • Facebook
  • Reddit
  • Pinterest
  • Email

March Stats Preview: Fewer Foreclosure Notices Edition

Posted on April 2, 2013April 2, 2013 by The Tim

Now that March is done, and April 1 fun is done, let’s have a look at our stats preview. Most of the charts below are based on broad county-wide data that is available through a simple search of King County and Snohomish County public records. If you have additional stats you’d like to see in…

Share:

  • Twitter
  • LinkedIn
  • Facebook
  • Reddit
  • Pinterest
  • Email

Case-Shiller Tiers: Low Tier Inched Up in January

Posted on March 27, 2013 by The Tim

Let’s check out the three price tiers for the Seattle area, as measured by Case-Shiller. Remember, Case-Shiller’s “Seattle” data is based on single-family home repeat sales in King, Pierce, and Snohomish counties. Note that the tiers are determined by sale volume. In other words, 1/3 of all sales fall into each tier. For more details…

Share:

  • Twitter
  • LinkedIn
  • Facebook
  • Reddit
  • Pinterest
  • Email

Case-Shiller: January Home Prices Calm Before the Storm

Posted on March 26, 2013 by The Tim

Let’s have a look at the latest data from the Case-Shiller Home Price Index. According to January data, Seattle-area home prices were: Down 0.3% December to January Up 8.7% YOY. Down 26.5% from the July 2007 peak Last year prices fell 0.7% from December to January and year-over-year prices were down 4.0%. Another month without…

Share:

  • Twitter
  • LinkedIn
  • Facebook
  • Reddit
  • Pinterest
  • Email

Sale Prices Plateau as Listings Keep Tanking

Posted on March 25, 2013 by The Tim

It’s been a while since I posted an update of my charts based on the stats from Redfin’s King County region page, so let’s take a look at those. First up the median list and sale prices per square foot. Note that the list price below includes all homes on the market, whether or not…

Share:

  • Twitter
  • LinkedIn
  • Facebook
  • Reddit
  • Pinterest
  • Email

Posts navigation

  • Previous
  • 1
  • …
  • 79
  • 80
  • 81
  • 82
  • 83
  • 84
  • 85
  • …
  • 145
  • Next

Tim’s Other Projects

Dispatches from the Multiverse

Tip Jar

Like what we're doing?

Drop us a tip!

Accounts

  • Log in
  • Entries feed
  • Comments feed
  • WordPress.org
©2024 Seattle Bubble | Built using WordPress and Responsive Blogily theme by Superb