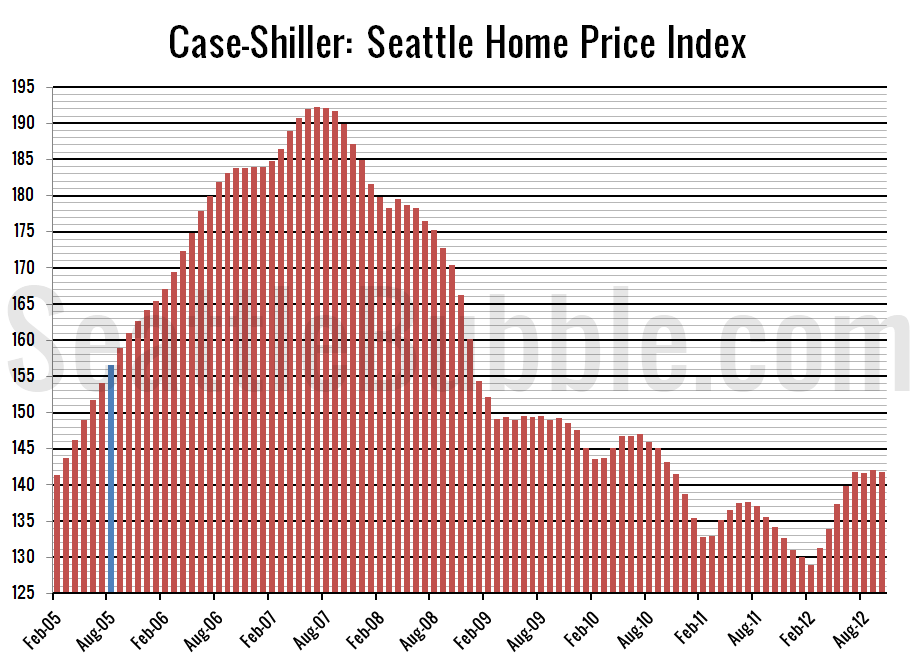
Let’s have a look at the latest data from the Case-Shiller Home Price Index. According to October data, Seattle-area home prices were: Down 0.2% September to October. Up 5.7% YOY. Down 26.3% from the July 2007 peak Last year prices fell 1.0% from September to October and year-over-year prices were down 6.2%. Nothing surprising here….
Category: Counties
County-wide statistics.
Sales of Expensive Non-Distressed Homes Surging
Let’s check in on the sales histogram again. In exploring this data, the biggest thing that jumps out to me is how much non-distressed homes above the median price have surged in the last year. Last November there were 407 non-distressed single-family homes sales in King County under $350,000 and 621 for $350,000 and up….
Local Foreclosures Flat in November
It’s time once again to expand on our preview of foreclosure activity with a more detailed look at November’s stats in King, Snohomish, and Pierce counties. First up, the Notice of Trustee Sale summary: November 2012 King: 870 NTS, up 106.7% YOY Snohomish: 536 NTS, up 168.0% YOY Pierce: 687 NTS, up 222.5% YOY All…
Non-Distressed Median Up Less Than 5% From 2011
Let’s check up on how median home sale prices broken down by distress status: Non-distressed, bank-owned, and short sales. As of November, the non-distressed median price for King County single family home sales sits at $430,000, up 4.9% from a year earlier. November matched this year’s high point from June. A 4.9% increase is decent,…
Bank-Owned Sales Still Slim
Even as we get into the season when non-distressed sales tend to fall off and distressed sales typically make up a larger percentage of sales, the share of monthly closed sales that were bank-owned homes held flat again, coming in at 6.6 percent in November. I had been expecting this to increase in November, but…
