Skip to content

Seattle Bubble

local real estate news, statistics, and commentary without the sales spin.

Menu
  • Home
  • About
  • Contact
  • Reference
  • Speaking
Menu

Category: Statistics

Statistics, number-based analysis, etc.

Share of sales in cheap parts of King County hit all-time high as prices keep climbing

Posted on March 22, 2018 by The Tim

It’s been nearly a year since we took a look at the in-county breakdown data from the NWMLS to see how the sales mix shifted around the county. I like to keep an eye on this not only to see how individual neighborhoods are doing but also to see how the sales mix shift affects the overall county-wide median price.
…
The most interesting thing in this data is that in February the share of sales in the South King regions hit an all-time high at 41.6 percent, just edging out the previous high of 41.4 percent set in November 2007 (just four months after prices peaked). Despite this continued shift in sales toward the lower-priced regions, the county-wide median price continues to push upward.

Share:

  • Twitter
  • LinkedIn
  • Facebook
  • Reddit
  • Pinterest
  • Email

King County median home price now $77k higher than “Affordable” home price

Posted on March 21, 2018 by The Tim

As promised in Monday’s affordability post, here’s an updated look at the “affordable home” price chart.

In this graph I flip the variables in the affordability index calculation around to other sides of the equation to calculate what price home the a family earning the median household income could “afford” to buy at today’s mortgage rates, if they spent 30% of their monthly gross income on their home payment. Don’t forget that this math includes the (giant) assumption that the home buyers putting 20% down, which would be $129,990 at today’s median price.

Share:

  • Twitter
  • LinkedIn
  • Facebook
  • Reddit
  • Pinterest
  • Email

Seattle-area affordability set to plunge to 9-year lows in 2018

Posted on March 19, 2018 by The Tim

If you’re wondering about the lack of posts on these pages recently, the explanation is pretty simple: There just isn’t much to say. The Seattle-area housing market has been in a protracted boom period with ridiculously low inventory of homes for sale and rapidly-climbing prices for years now. In a lot of ways it looks like the housing bubble that was in full swing when I started this blog in 2005, but what’s going on behind the scenes is very different this time around. Is it possible that Seattle really is special this time around and the “bubble” won’t burst this time? … Maybe?

Anyway, I’ve been meaning to update more of the charts of the “fundamentals,” so let’s start with an updated look at our affordability index charts for the counties around Puget Sound.

Share:

  • Twitter
  • LinkedIn
  • Facebook
  • Reddit
  • Pinterest
  • Email

NWMLS: Closed sales plummet, listings still scarce

Posted on February 6, 2018 by The Tim

January market stats have been published by the NWMLS. Here’s a quick excerpt from their press release:

Home Buyers Still Competing for Sparse Inventory in Western Washington, Driving Up Prices – Especially for Sought-After Condominiums

“The Seattle area real estate market hasn’t skipped a beat with pent-up demand from buyers is stronger than ever,” remarked broker John Deely in reacting to the latest statistics from Northwest Multiple Listing Service. The report on January activity shows a slight year-over-year gain in pending sales, a double-digit increase in prices, and continued shortages of inventory.
…
“The decline in sales last month can’t be blamed on the holidays, weather or football. It’s simply due to the ongoing shortage of housing that continues to plague markets throughout Western Washington,” said OB Jacobi, the president of Windermere Real Estate.

Bummer for home salespeople that they can’t use the “football” excuse they usually throw out in January. Not that there’s really anything in these latest numbers for them to be concerned about.

Now let’s dive into the numbers for January…

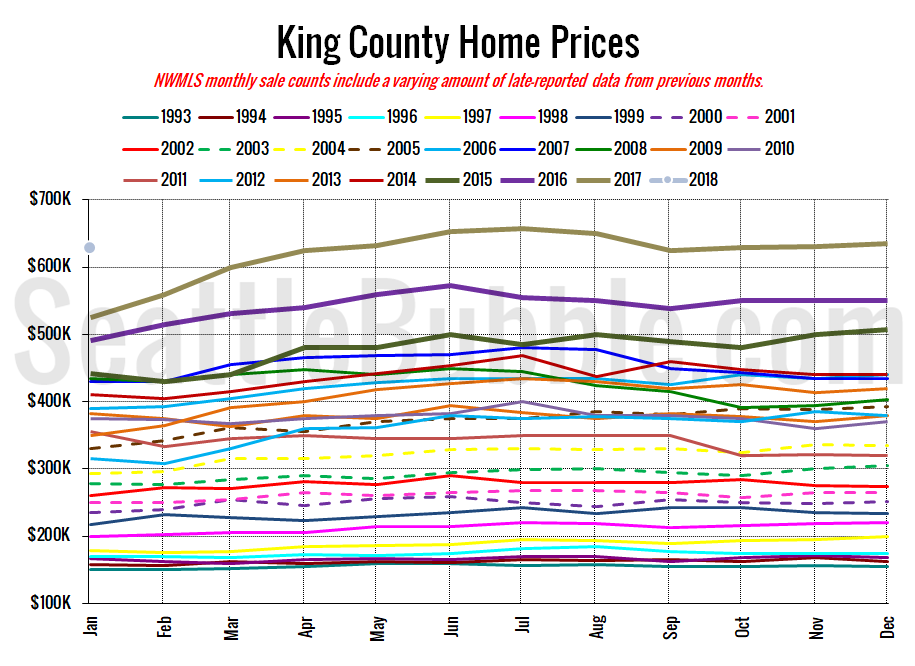
Inventory is at its lowest January level ever, and new listings were only barely above last year’s record-low level. Despite having nearly the same number of new listings as last year, closed sales and pending sales are both down considerably. Meanwhile, prices are up nearly twenty percent year-over-year.

Share:

  • Twitter
  • LinkedIn
  • Facebook
  • Reddit
  • Pinterest
  • Email

January Stats Preview: 2018 kicks off with the same tight market as 2017

Posted on February 5, 2018 by The Tim

Here’s the summary for January: Yet another new all-time low point for inventory in both counties. Sales were lower than a year earlier, but not dramatically. Foreclosures are still basically zero.

Here’s the snapshot of all the data as far back as my historical information goes, with the latest, high, and low values highlighted for each series:

King & Snohomish County Stats Preview

So far there are no glimmers of hope for buyers as 2018 kicks off.

Share:

  • Twitter
  • LinkedIn
  • Facebook
  • Reddit
  • Pinterest
  • Email

Posts navigation

  • Previous
  • 1
  • …
  • 11
  • 12
  • 13
  • 14
  • 15
  • 16
  • 17
  • …
  • 222
  • Next

Tim’s Other Projects

Dispatches from the Multiverse

Tip Jar

Like what we're doing?

Drop us a tip!

Accounts

  • Log in
  • Entries feed
  • Comments feed
  • WordPress.org
©2024 Seattle Bubble | Built using WordPress and Responsive Blogily theme by Superb