Skip to content

Seattle Bubble

local real estate news, statistics, and commentary without the sales spin.

Menu
  • Home
  • About
  • Contact
  • Reference
  • Speaking
Menu

Category: Statistics

Statistics, number-based analysis, etc.

Around the Sound: Hope is Hard to Find for Buyers

Posted on April 8, 2016April 20, 2016 by The Tim

We haven’t updated our monthly stats for the local regions outside of the King/Snohomish core since last year, so let’s have a look. Here’s your March update to our “Around the Sound” statistics for Pierce, Kitsap, Thurston, Island, Skagit, and Whatcom counties.

How is the market doing outside of the central King County area? Not much different, really. Listings are super-scarce, demand is reasonably strong, and prices keep going up…

Share:

  • Twitter
  • LinkedIn
  • Facebook
  • Reddit
  • Pinterest
  • Email

NWMLS: Some Small Signs of Market Softening in March

Posted on April 5, 2016April 8, 2016 by The Tim

March market stats were published by the NWMLS yesterday…

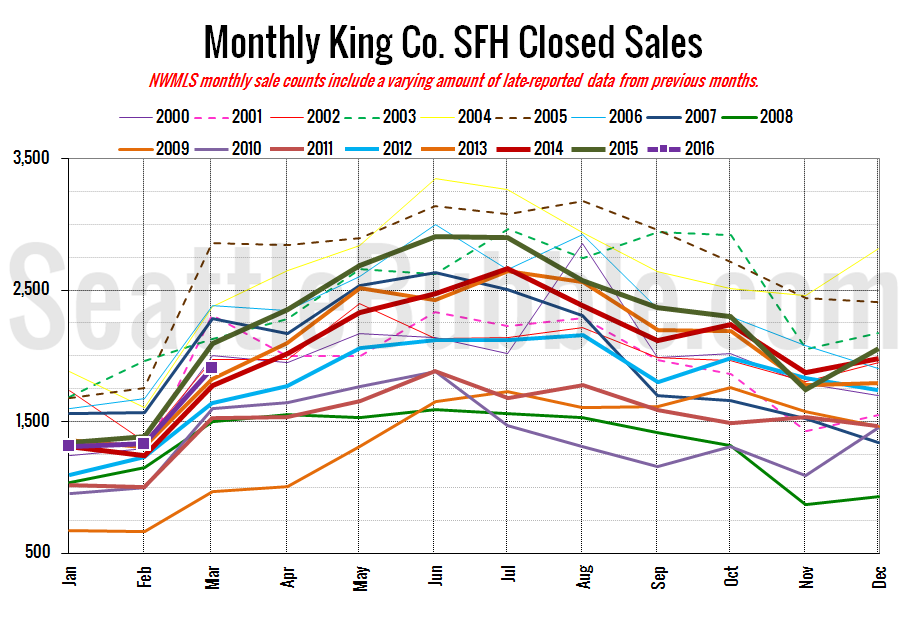
…First the good news for buyers: Inventory saw a slight uptick in March, and the year-over-year drop shrunk significantly from -29 percent in February to -21 percent in March. Sales also appear to be slowing down slightly as both pending and closed sales are down around ten percent from a year ago.

Now the bad news: The median home price shot up to a new all-time high, and the year-over-year median price was up a record-breaking 21 percent.

Share:

  • Twitter
  • LinkedIn
  • Facebook
  • Reddit
  • Pinterest
  • Email

March Stats Preview: A Faint Glimmer of Hope for Listings

Posted on April 1, 2016April 1, 2016 by The Tim

Sorry, no April Fool’s jokes today. Just a look at March stats with our monthly stats preview.

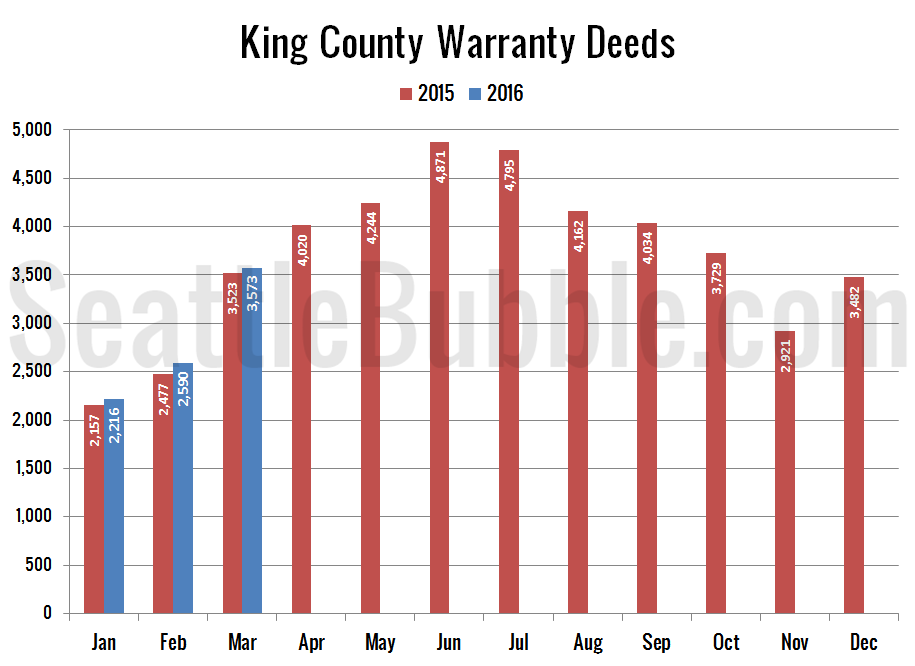
For the most part, it’s the same story we’ve been seeing for the past couple years. Low inventory, low sales, and few foreclosures. However, there was a new tiny glimmer of hope for buyers looking for more listings: The month-over-month increase in listing inventory in March was the largest we’ve seen in nearly two years. We’re still down from a year ago, but maybe we’re starting to see the very beginning of a listing recovery…

Share:

  • Twitter
  • LinkedIn
  • Facebook
  • Reddit
  • Pinterest
  • Email

Case-Shiller Tiers: High Tier Prices Slip Slightly in January

Posted on March 30, 2016March 30, 2016 by The Tim

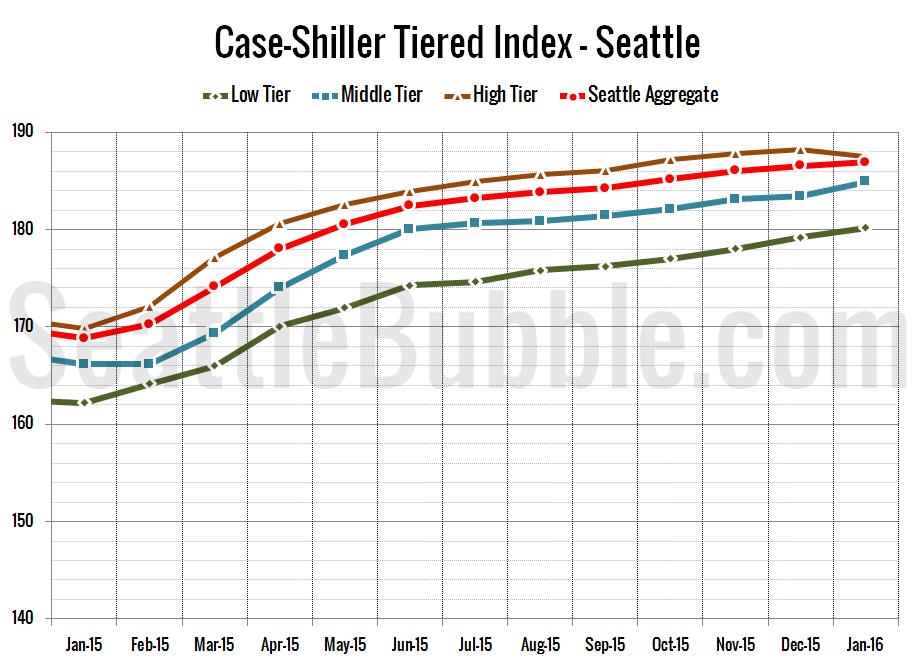
Let’s check out the three price tiers for the Seattle area, as measured by Case-Shiller. Remember, Case-Shiller’s “Seattle” data is based on single-family home repeat sales in King, Pierce, and Snohomish counties.

There was a slight divergence in January, with the low and middle tiers increasing and the high tier decreasing month-over-month…

Share:

  • Twitter
  • LinkedIn
  • Facebook
  • Reddit
  • Pinterest
  • Email

Case-Shiller: No Winter Price Dip For You!

Posted on March 29, 2016March 29, 2016 by The Tim

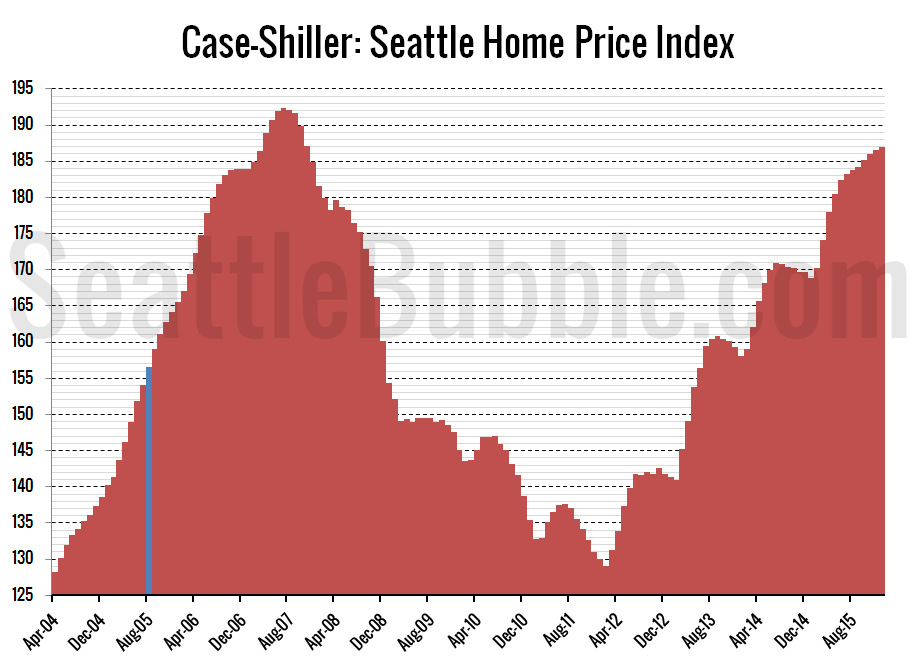
Let’s have a look at the latest data from the Case-Shiller Home Price Index. According to January data that was released today, Seattle-area home prices were:

Up 0.2 percent December to January
Up 10.7 percent YOY.
Down 2.8 percent from the July 2007 peak

Over the same period in 2014-2015 prices were down 0.5 percent month-over-month and year-over-year prices were up 6.8 percent.

The Seattle area’s month-over-month home price change was positive again in January…

Share:

  • Twitter
  • LinkedIn
  • Facebook
  • Reddit
  • Pinterest
  • Email

Posts navigation

  • Previous
  • 1
  • …
  • 27
  • 28
  • 29
  • 30
  • 31
  • 32
  • 33
  • …
  • 222
  • Next

Tim’s Other Projects

Dispatches from the Multiverse

Tip Jar

Like what we're doing?

Drop us a tip!

Accounts

  • Log in
  • Entries feed
  • Comments feed
  • WordPress.org
©2024 Seattle Bubble | Built using WordPress and Responsive Blogily theme by Superb
Menu
  • Home
  • About
  • Contact
  • Reference
  • Speaking