Skip to content

Seattle Bubble

local real estate news, statistics, and commentary without the sales spin.

Menu
  • Home
  • About
  • Contact
  • Reference
  • Speaking
Menu

Category: Statistics

Statistics, number-based analysis, etc.

September Stats Preview: Setting Up a Dismal Fall and Winter

Posted on October 2, 2015October 26, 2015 by The Tim

Now that September is in the books, let’s have a look at our monthly stats preview.

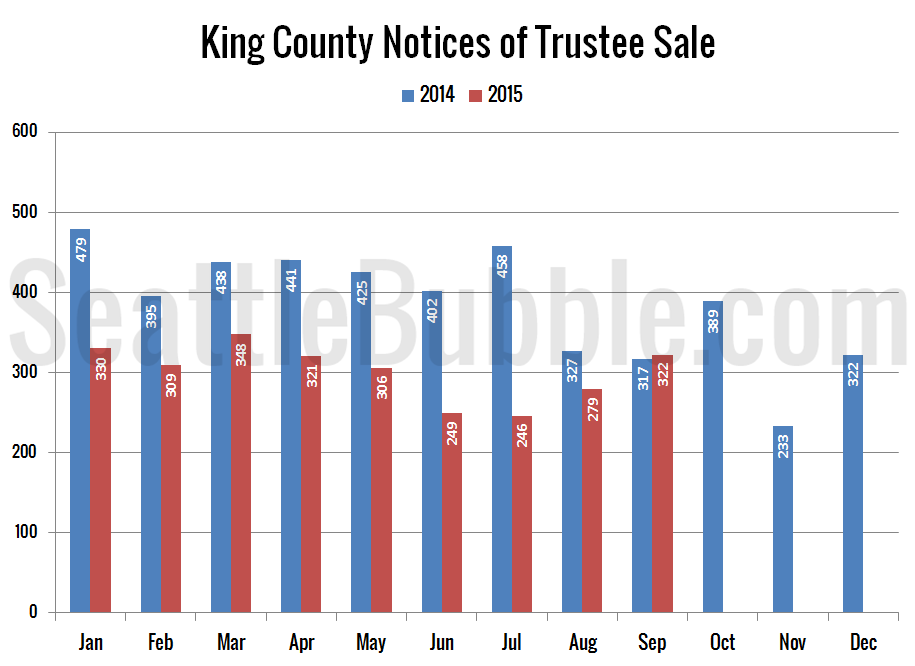
Sales were basically flat month-over-month, but still up double-digits from a year ago, while inventory in both counties saw the biggest year-over-year decline in more than two years. Foreclosure notices in both counties bumped up a little month-over-month and year-over-year…

Share:

  • Twitter
  • LinkedIn
  • Facebook
  • Reddit
  • Pinterest
  • Email

Case-Shiller Tiers: Price Gains Slowed Slightly in July

Posted on September 30, 2015October 26, 2015 by The Tim

Let’s check out the three price tiers for the Seattle area, as measured by Case-Shiller. Remember, Case-Shiller’s “Seattle” data is based on single-family home repeat sales in King, Pierce, and Snohomish counties.

All three tiers were up month-over-month yet again in July. However, the gains in all three tiers were much smaller than they have been for the previous few months…

Share:

  • Twitter
  • LinkedIn
  • Facebook
  • Reddit
  • Pinterest
  • Email

Case-Shiller: Seattle Home Prices Climb Steadily in July

Posted on September 29, 2015September 30, 2015 by The Tim

Let’s have a look at the latest data from the Case-Shiller Home Price Index. According to July data, Seattle-area home prices were:

Up 0.5% June to July
Up 7.3% YOY.
Down 4.7% from the July 2007 peak

…

Share:

  • Twitter
  • LinkedIn
  • Facebook
  • Reddit
  • Pinterest
  • Email

Actual Home Prices Edging Above the “Affordable” Price

Posted on September 24, 2015September 29, 2015 by The Tim

Here’s an updated look at the “affordable home” price chart.

In this graph I flip the variables in the affordability index calculation around to other sides of the equation to calculate what price home the a family earning the median household income could afford to buy at today’s mortgage rates if they put 20% down and spent 30% of their monthly income.

The “affordable” home price hit $496,051 back in April, but has since dropped off…

Share:

  • Twitter
  • LinkedIn
  • Facebook
  • Reddit
  • Pinterest
  • Email

Affordability Will Be Destroyed if Interest Rates Increase

Posted on September 23, 2015September 27, 2022 by The Tim

Don’t forget, you can get access to the spreadsheets used to make the charts in this and other posts by becoming a member of Seattle Bubble. It’s been a few months since we took a look at the local affordability index. So, let’s have a new look at all of our affordability index charts. As…

Share:

  • Twitter
  • LinkedIn
  • Facebook
  • Reddit
  • Pinterest
  • Email

Posts navigation

  • Previous
  • 1
  • …
  • 32
  • 33
  • 34
  • 35
  • 36
  • 37
  • 38
  • …
  • 222
  • Next

Tim’s Other Projects

Dispatches from the Multiverse

Tip Jar

Like what we're doing?

Drop us a tip!

Accounts

  • Log in
  • Entries feed
  • Comments feed
  • WordPress.org
©2024 Seattle Bubble | Built using WordPress and Responsive Blogily theme by Superb