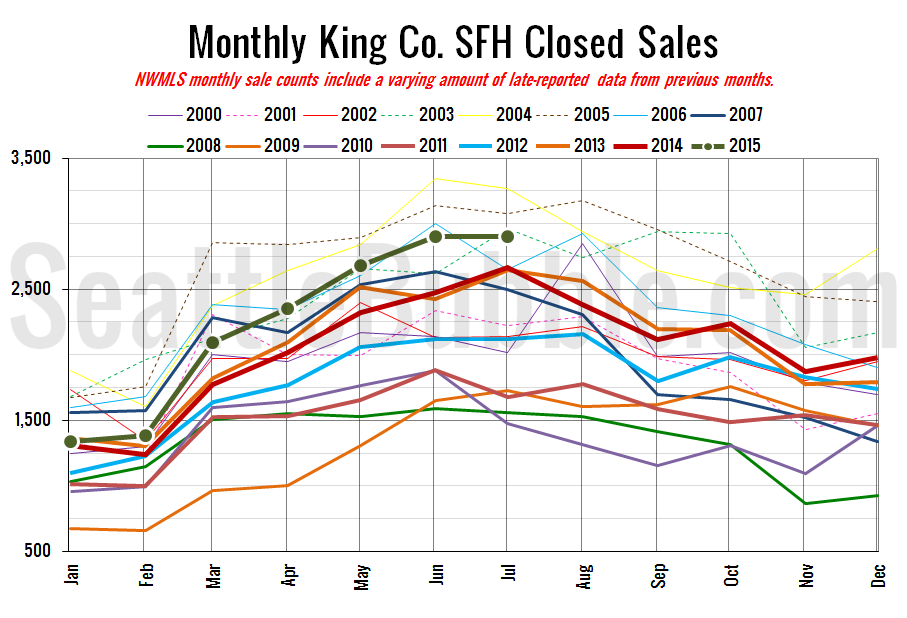
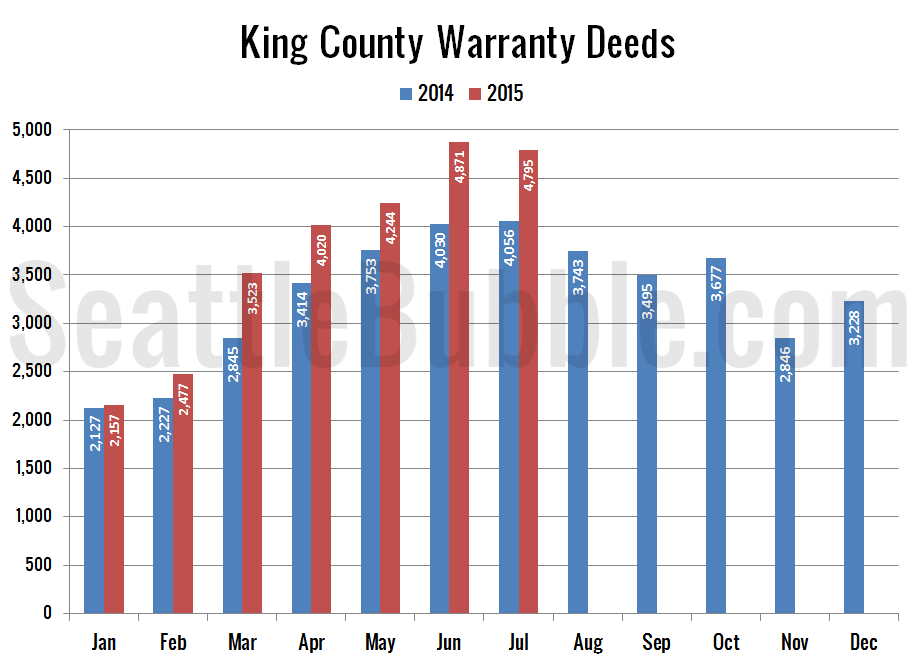
July market stats were published by the NWMLS today. Before we get into our monthly stats, here’s a quick look at their press release. Pent up demand boosting Western Washington home sales and prices Pent-up demand continues to fuel home sales around Western Washington with millennials, military families and relocating workers vying for limited inventory….
Category: Statistics
Statistics, number-based analysis, etc.
July Stats Preview: Stale Summer Edition
July is in the books, so let’s have a look at our monthly stats preview. First up, here’s the snapshot of all the data as far back as my historical information goes, with the latest, high, and low values highlighted for each series: Sales came down just slightly from the multi-year highs they hit in…
Case-Shiller Tiers: Strong But Slowing Monthly Gains
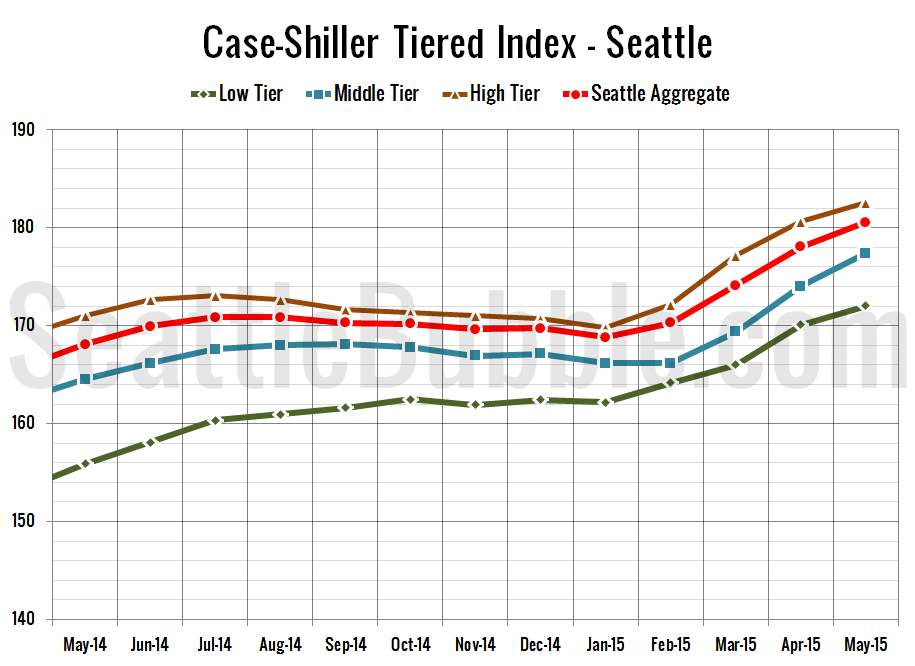
Let’s check out the three price tiers for the Seattle area, as measured by Case-Shiller. Remember, Case-Shiller’s “Seattle” data is based on single-family home repeat sales in King, Pierce, and Snohomish counties. Note that the tiers are determined by sale volume. In other words, 1/3 of all sales fall into each tier. For more details…
Case-Shiller: More Strong Price Gains in May
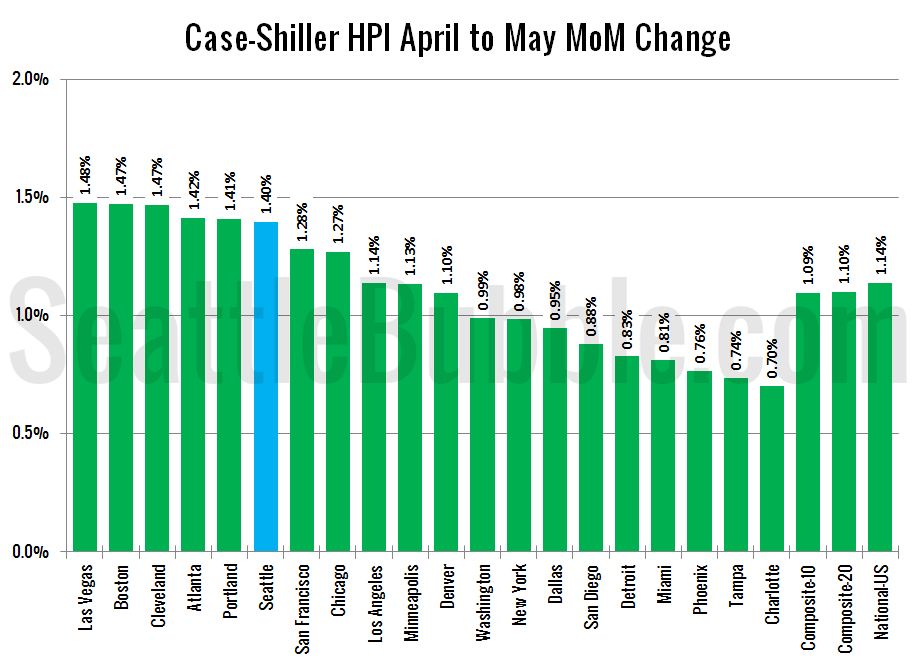
Let’s have a look at the latest data from the Case-Shiller Home Price Index. According to April data, Seattle-area home prices were: Up 1.4% April to May Up 7.4% YOY. Down 6.1% from the July 2007 peak Last year at this time prices rose 1.4% month-over-month and year-over-year prices were up 9.3%. The Seattle area’s…
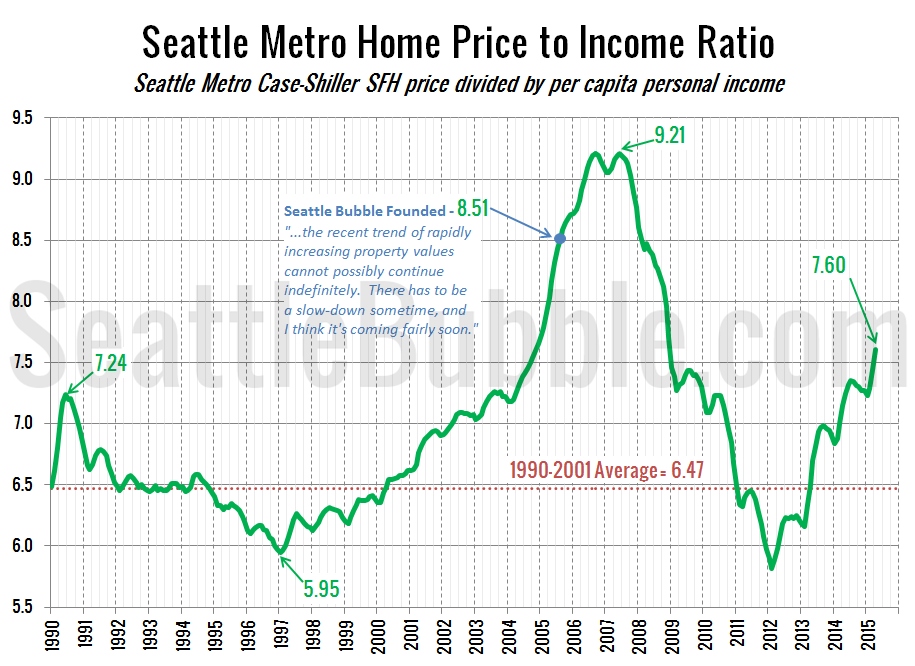
Price to Income Ratio Back in Bubble Territory
It has been a while since we last looked at one of our primary housing bubble metrics: local home prices compared to incomes. In the next chart I am using the Case-Shiller Home Price Index for the Seattle area (which rolls together King, Snohomish, and Pierce counties) and Bureau of Economic Analysis data on per…
