Skip to content

Seattle Bubble

local real estate news, statistics, and commentary without the sales spin.

Menu
  • Home
  • About
  • Contact
  • Reference
  • Speaking
Menu

Category: Statistics

Statistics, number-based analysis, etc.

Case-Shiller: Home Prices Shot Up in March

Posted on May 26, 2015May 28, 2015 by The Tim

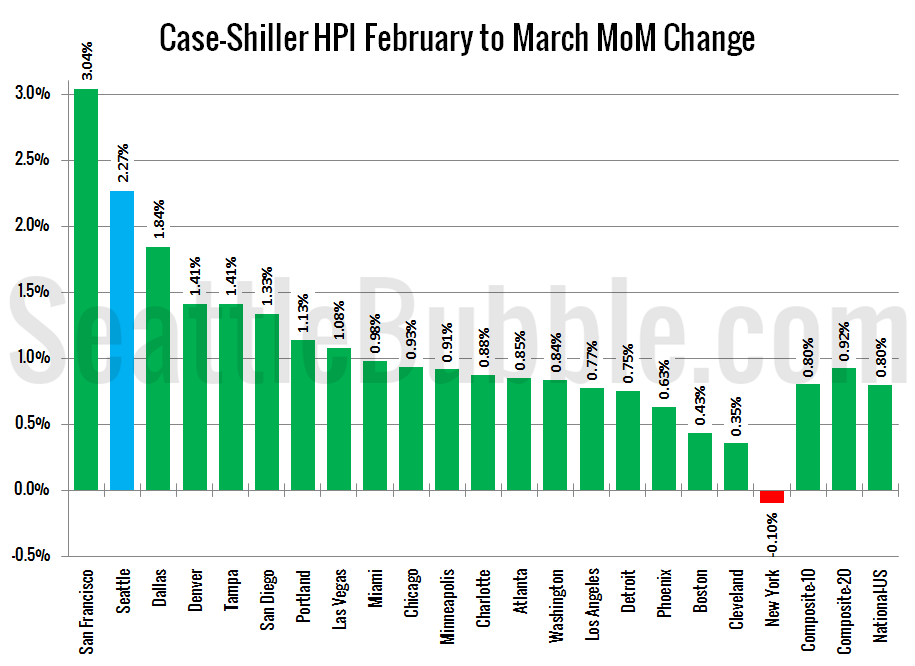
Let’s have a look at the latest data from the Case-Shiller Home Price Index. According to March data, Seattle-area home prices were: Up 2.3% February to March Up 7.5% YOY. Down 9.4% from the July 2007 peak Last year at this time prices rose 1.9% month-over-month and year-over-year prices were up 11.6%. Year-over-year price gains…

Share:

  • Twitter
  • LinkedIn
  • Facebook
  • Reddit
  • Pinterest
  • Email

Low Rates Add $120K to the “Affordable” Home Price

Posted on May 21, 2015May 26, 2015 by The Tim

As promised in yesterday’s affordability post, here’s an updated look at the “affordable home” price chart. In this graph I flip the variables in the affordability index calculation around to other sides of the equation to calculate what price home the a family earning the median household income could afford to buy at today’s mortgage…

Share:

  • Twitter
  • LinkedIn
  • Facebook
  • Reddit
  • Pinterest
  • Email

Affordability Index Kept Under Control by Low Rates

Posted on May 20, 2015May 21, 2015 by The Tim

A reader pointed out that we haven’t looked at how the affordability index is doing in the Seattle area since late last year. Let’s update our standard charts. So how does affordability look as of April? Despite median home prices shooting up, falling interest rates that are back below 4 percent again have kept the…

Share:

  • Twitter
  • LinkedIn
  • Facebook
  • Reddit
  • Pinterest
  • Email

Around the Sound: Strong Seller’s Market Everywhere

Posted on May 12, 2015May 13, 2015 by The Tim

It has been a while since we checked up on stats outside of the King/Snohomish core, so let’s update our “Around the Sound” statistics for Pierce, Kitsap, Thurston, Island, Skagit, and Whatcom counties. This month’s story in a nutshell: Bad news for buyers, great news for sellers. It’s pretty much a terrible time to buy…

Share:

  • Twitter
  • LinkedIn
  • Facebook
  • Reddit
  • Pinterest
  • Email
King County Median Price: Nominal and Real

Median Price May Pass Inflation-Adjusted Peak This Year

Posted on May 8, 2015May 12, 2015 by The Tim

As promised, I’ve updated my chart of nominal and real (inflation-adjusted) King County median single-family home prices with data through April. When adjusting into 2015 dollars, the median price peaked at $527,607 in July 2007. April 2015’s median price of $480,000 comes in about 9 percent below that level, and is roughly comparable to where…

Share:

  • Twitter
  • LinkedIn
  • Facebook
  • Reddit
  • Pinterest
  • Email

Posts navigation

  • Previous
  • 1
  • …
  • 39
  • 40
  • 41
  • 42
  • 43
  • 44
  • 45
  • …
  • 222
  • Next

Tim’s Other Projects

Dispatches from the Multiverse

Tip Jar

Like what we're doing?

Drop us a tip!

Accounts

  • Log in
  • Entries feed
  • Comments feed
  • WordPress.org
©2024 Seattle Bubble | Built using WordPress and Responsive Blogily theme by Superb