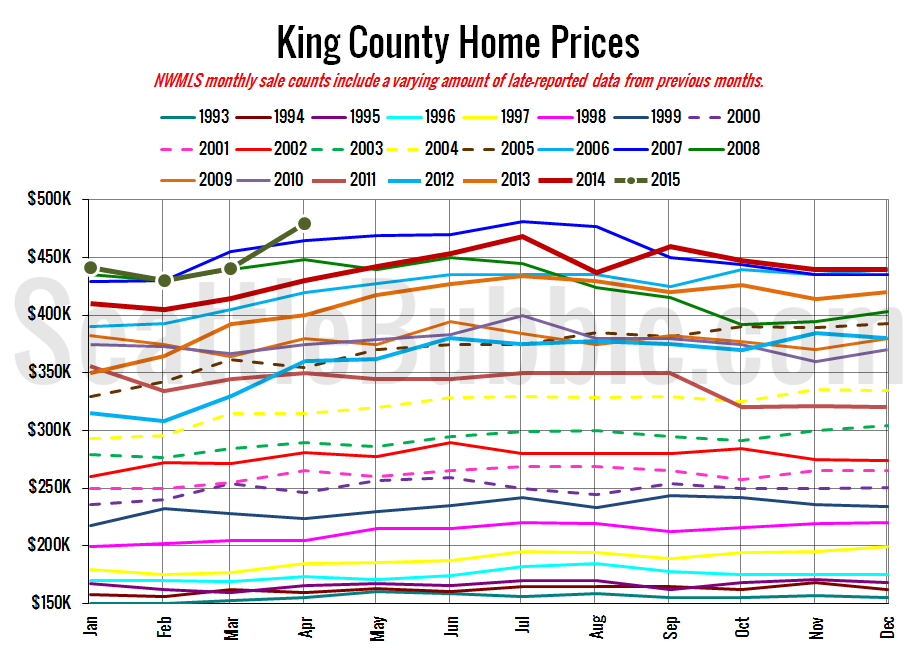
April market stats were published by the NWMLS yesterday. Before we get into our monthly stats, here’s a quick look at their press release. Pent-up demand triggering record pace of home sales around Western Washington Northwest Multiple Listing Service members notched a record high level of pending sales during April, surpassing the year-ago volume by…
Category: Statistics
Statistics, number-based analysis, etc.
April Stats Preview: Surging Sales Edition
With April 2015 now in the rear view mirror, let’s have a look at our monthly stats preview. First up, here’s the snapshot of all the data as far back as my historical information goes, with the latest, high, and low values highlighted for each series: First, a tiny ray of good news… Listing inventory…
Case-Shiller Tiers: Low Tier Back to Double-Digit Gains
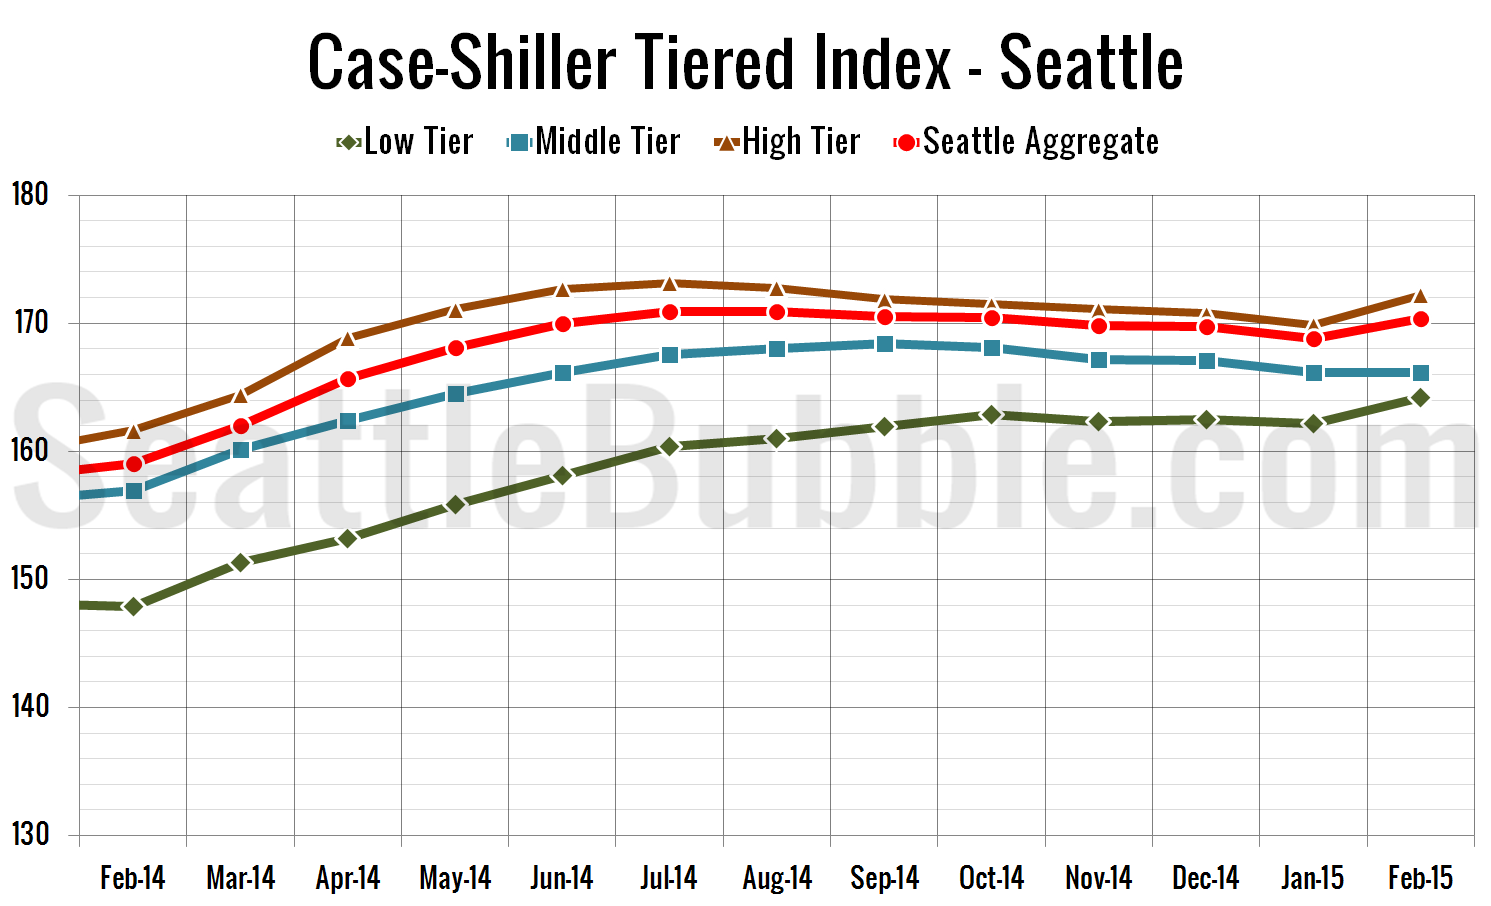
Let’s check out the three price tiers for the Seattle area, as measured by Case-Shiller. Remember, Case-Shiller’s “Seattle” data is based on single-family home repeat sales in King, Pierce, and Snohomish counties. Note that the tiers are determined by sale volume. In other words, 1/3 of all sales fall into each tier. For more details…
Case-Shiller: Seattle Home Prices Boosted in February
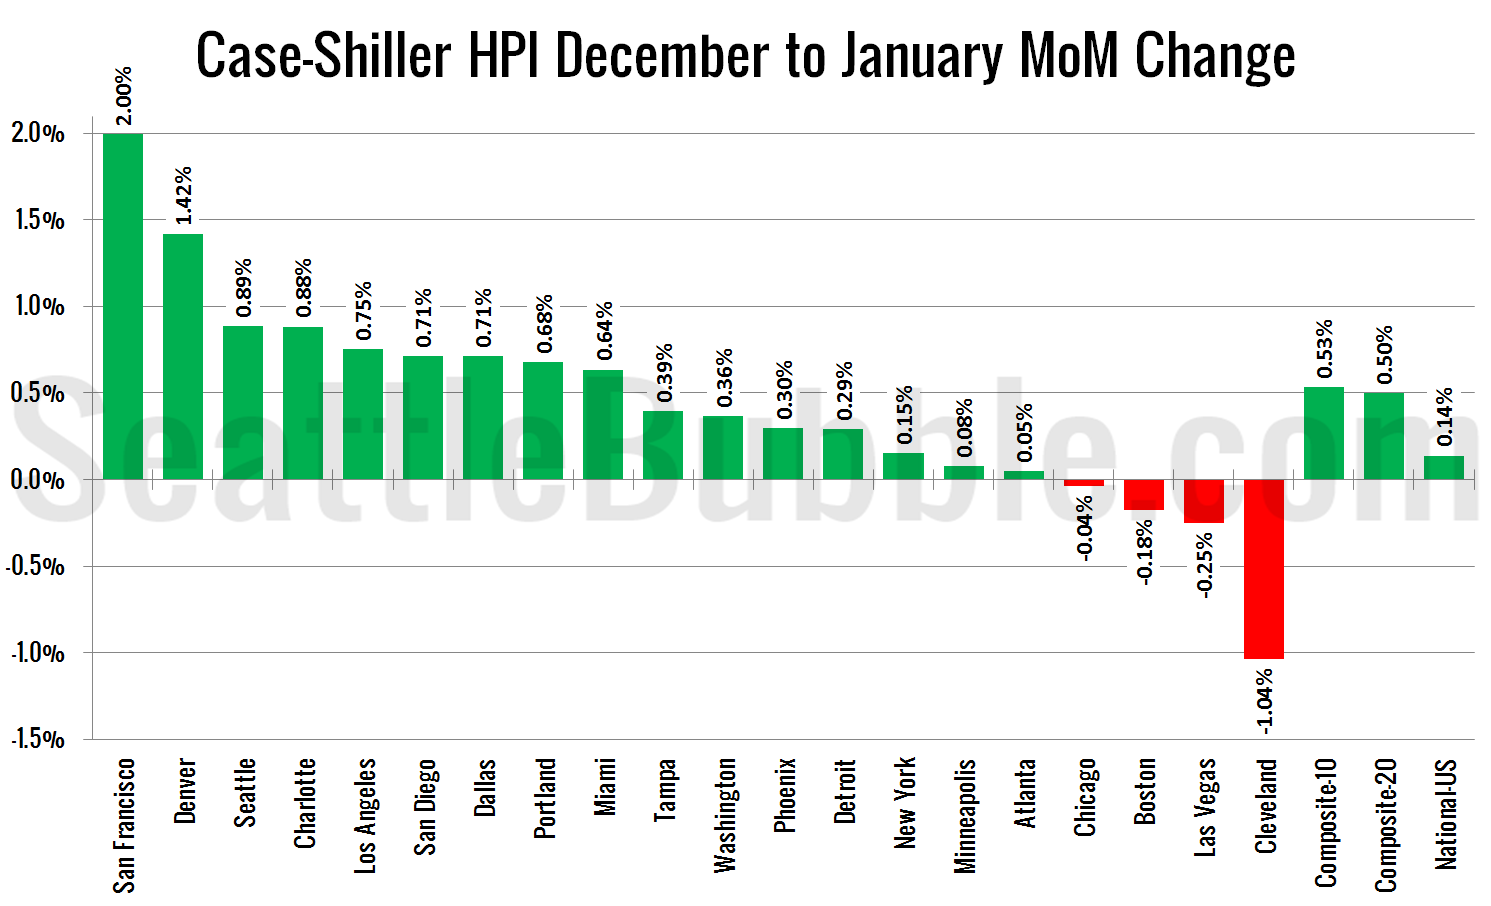
Let’s have a look at the latest data from the Case-Shiller Home Price Index. According to February data, Seattle-area home prices were: Up 0.9% January to February Up 7.1% YOY. Down 11.4% from the July 2007 peak Last year at this time prices rose 0.6% month-over-month and year-over-year prices were up 12.8%. Year-over-year price gains…
How Deep is the Current Listings Drought?
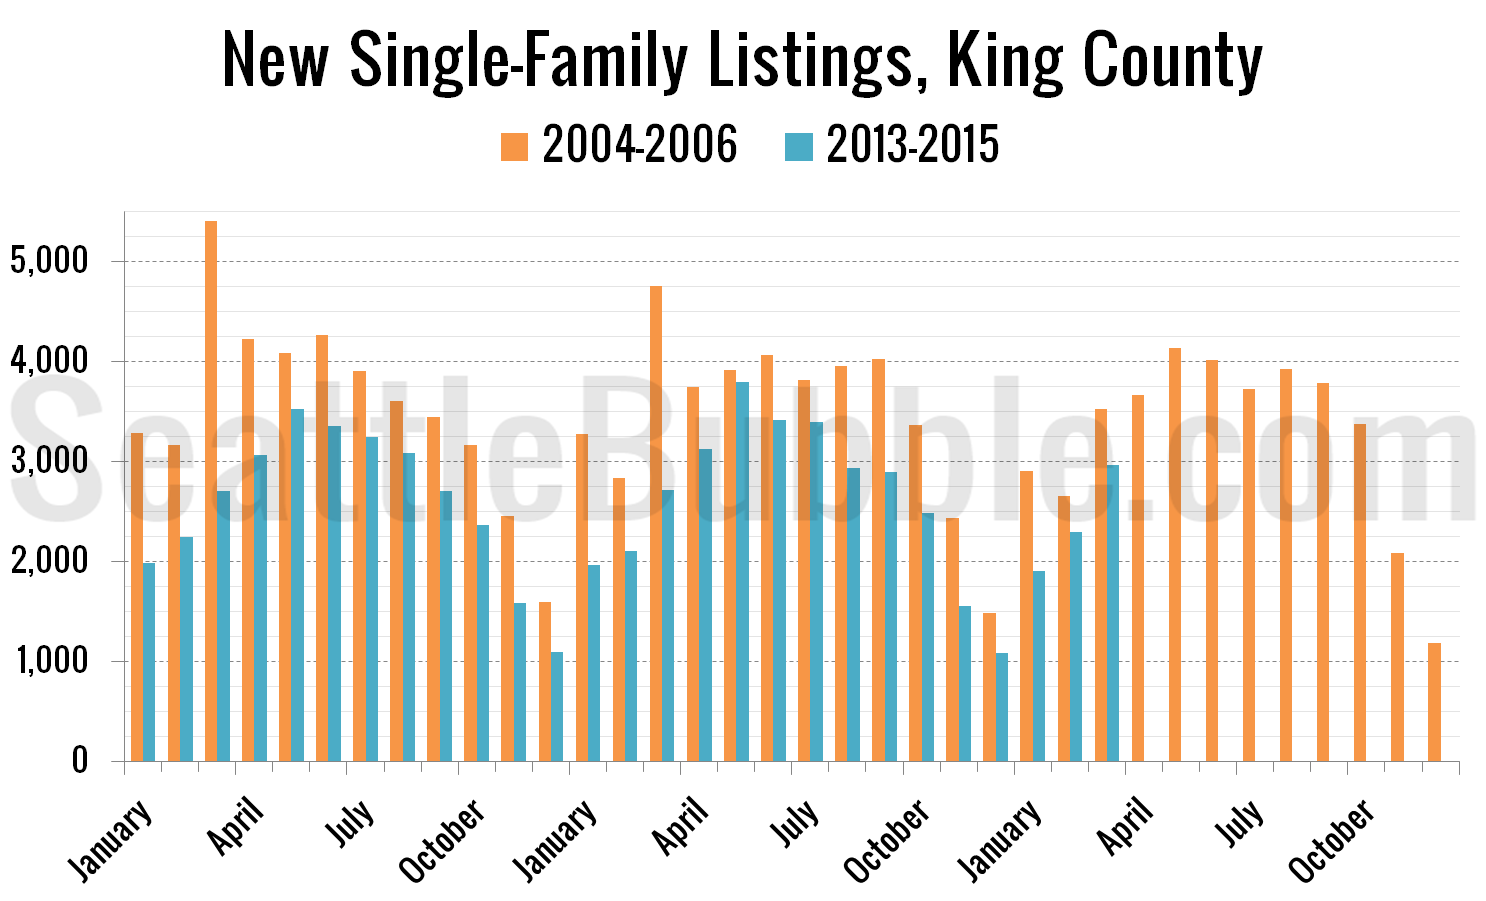
I thought it would be interesting to take a deeper look at the depth of the current listings drought by comparing monthly new listings over the last few years to the same period during the previous bubble (before listings began to increase in 2007). Here’s a view of the number of new single-family homes that…


