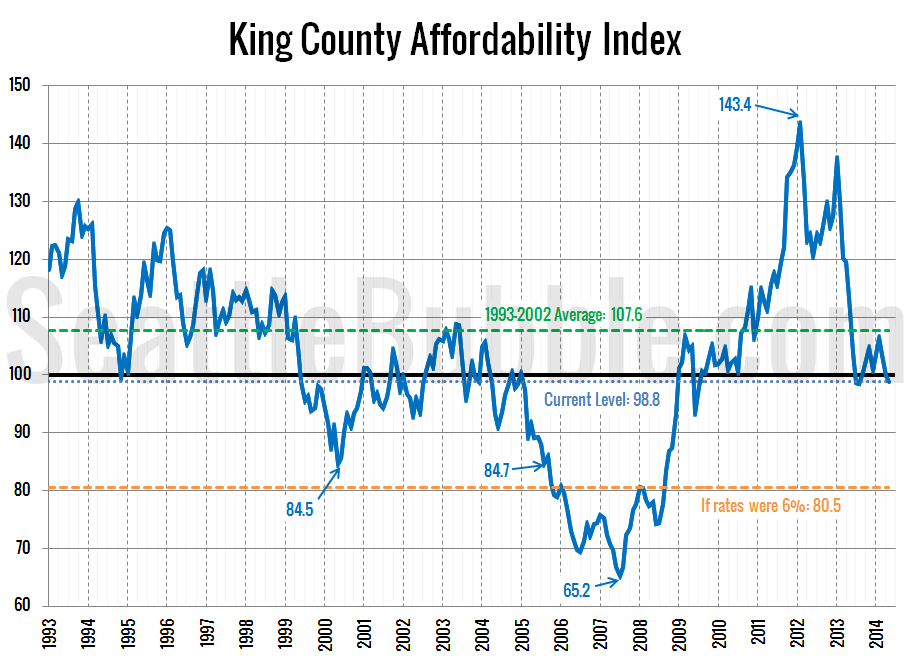
Let’s take a look at how affordability is doing in the Seattle area after the last couple months of changes in home prices and interest rates. So how does affordability look as of May? Thanks to the spring surge in home prices, we’ve dropped back below the “affordable” level of 100. The index sits at…
Category: Statistics
Statistics, number-based analysis, etc.
Around the Sound: More Listings, Fewer Sales
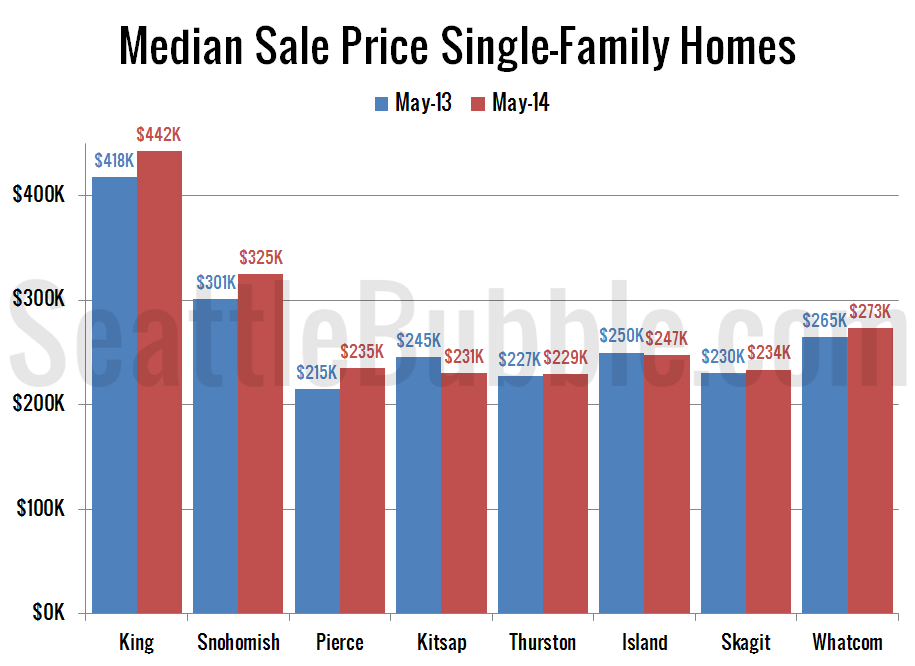
It’s time for us to check up on stats outside of the King/Snohomish core with our “Around the Sound” statistics for Pierce, Kitsap, Thurston, Island, Skagit, and Whatcom counties. If there is certain data you would like to see or ways you would like to see the data presented differently, drop a comment below and…
Foreclosures Inched Up Just Barely in May
It’s time for our detailed look at March’s foreclosure stats in King, Snohomish, and Pierce counties. First up, the Notice of Trustee Sale summary: May 2013 King: 425 NTS, down 36% YOY Snohomish: 197 NTS, down 54% YOY Pierce: 323 NTS, down 41% YOY The number of trustee sale notices is still falling fast from…
New Listings Hit a Six-Year High for Month of May
Let’s take a closer look at how listings fared in May of this year compared to years past. First up, here’s a look at how many new listings hit the market in May, comparing May 2014 to May in every year I’ve got data for. New listings hit a six-year high for the month of…
Sales Falling Across King County, Seattle Drops Least
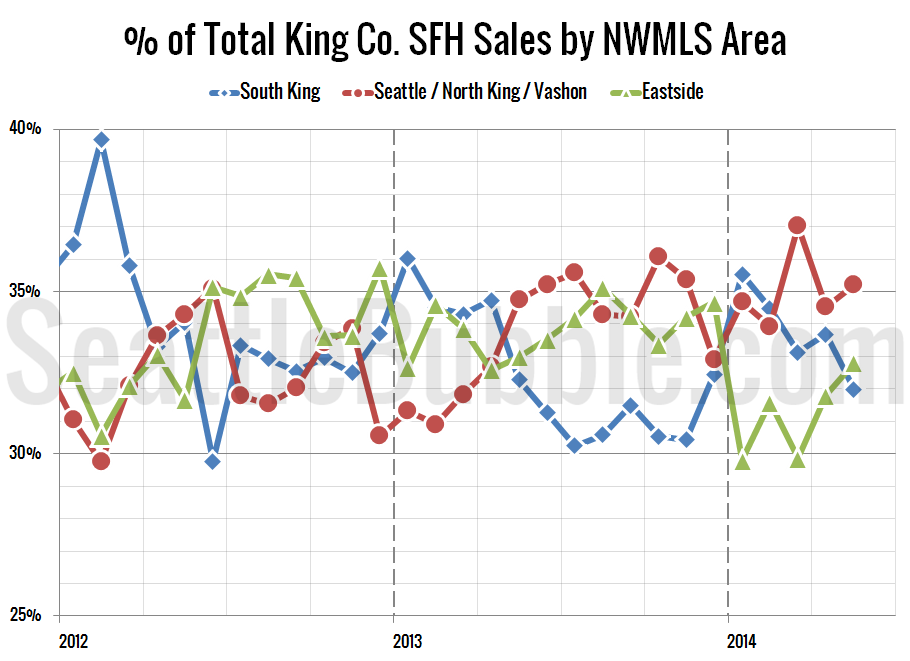
It’s time once again to take an updated look at how King County’s sales are shifting between the different regions around the county, since geographic shifts can and do affect the median price. In order to explore this concept, we break King County down into three regions, based on the NWMLS-defined “areas”: low end: South…


