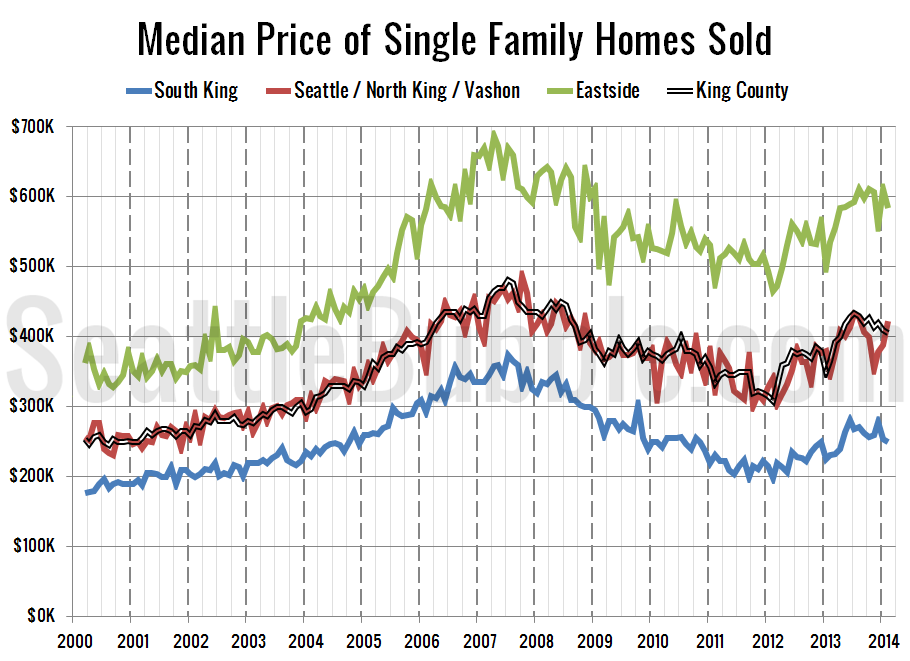
It’s time once again to take an updated look at how King County’s sales are shifting between the different regions around the county, since geographic shifts can and do affect the median price. In order to explore this concept, we break King County down into three regions, based on the NWMLS-defined “areas”: low end: South…
Category: Statistics
Statistics, number-based analysis, etc.
NWMLS: Sales Are Slipping Because of the Seahawks
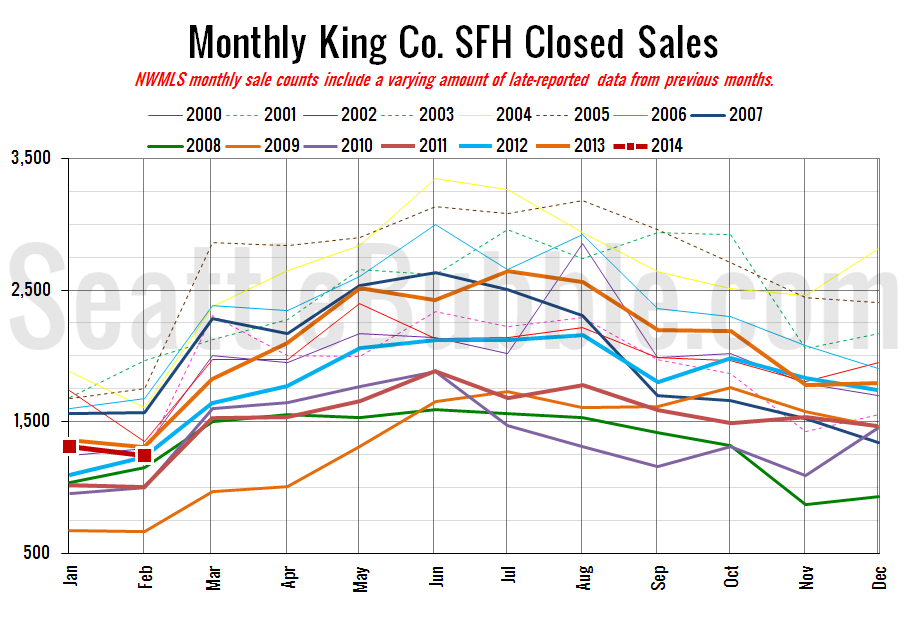
February market stats were published by the NWMLS earlier today. I had an extremely busy day so I’m only just now getting to posting them. Here’s a snippet from their press release: Home Sales Shrink as Buyers Take a Timeout due to Inventory shortages, Seahawks Playoffs. Northwest Multiple Listing Service brokers reported 507 fewer pending…
February Stats Preview: Slow Start Edition
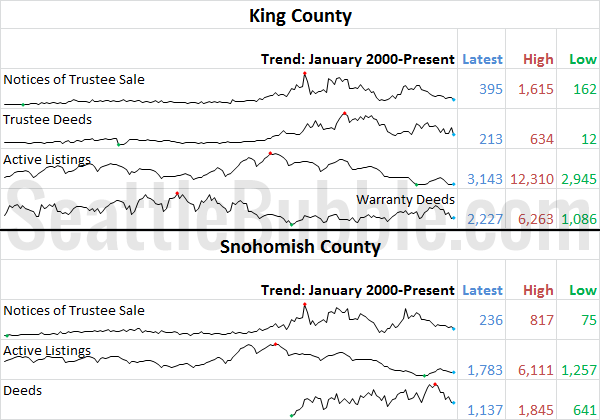
With February now complete, let’s have a look at our monthly stats preview. Most of the charts below are based on broad county-wide data that is available through a simple search of King County and Snohomish County public records. If you have additional stats you’d like to see in the preview, drop a line in…
Undervalued to Overvalued in Less Than a Year
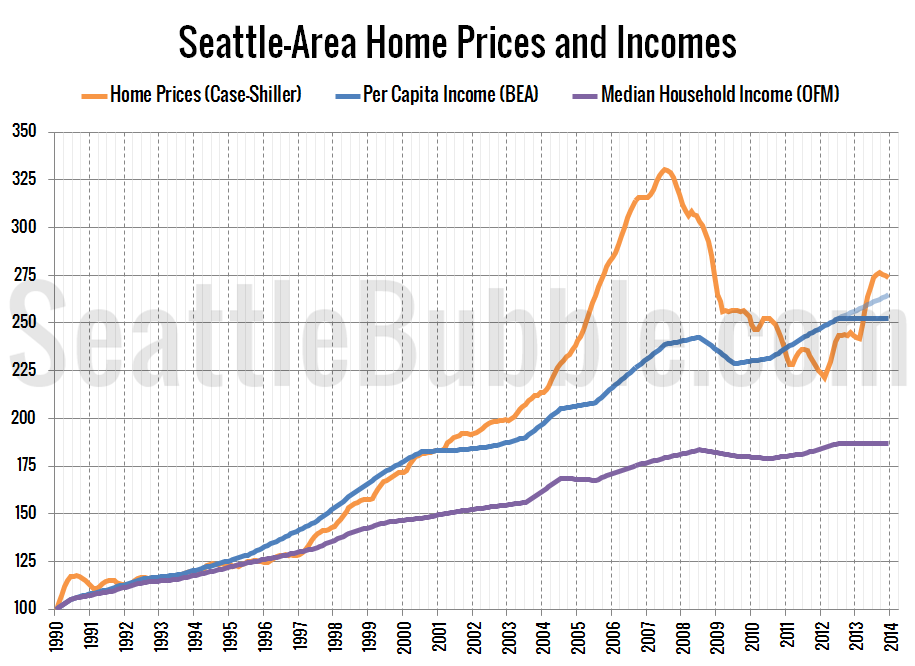
Local home prices gone from undervalued to overvalued in just a year. In January 2013, Seattle-area home prices as measured by the Case-Shiller Home Price Index were four or five percent below where local per capita incomes would suggest they should have been and one percent below where rents suggested. By December 2013, massive gains…
Case-Shiller Tiers: Low Tier Dripped Most in December
Let’s check out the three price tiers for the Seattle area, as measured by Case-Shiller. Remember, Case-Shiller’s “Seattle” data is based on single-family home repeat sales in King, Pierce, and Snohomish counties. Note that the tiers are determined by sale volume. In other words, 1/3 of all sales fall into each tier. For more details…


