It’s been quite a while since we last had a look at the percentage of pending sales that turn into closed sales, so let’s refresh that chart and take a look a the latest data. This particular series is fairly noisy when you look at it with monthly granularity, so for this post I’ve rolled…
Category: Statistics
Statistics, number-based analysis, etc.
Consumer Confidence Flat, Rates Back to Mid-2011 Levels
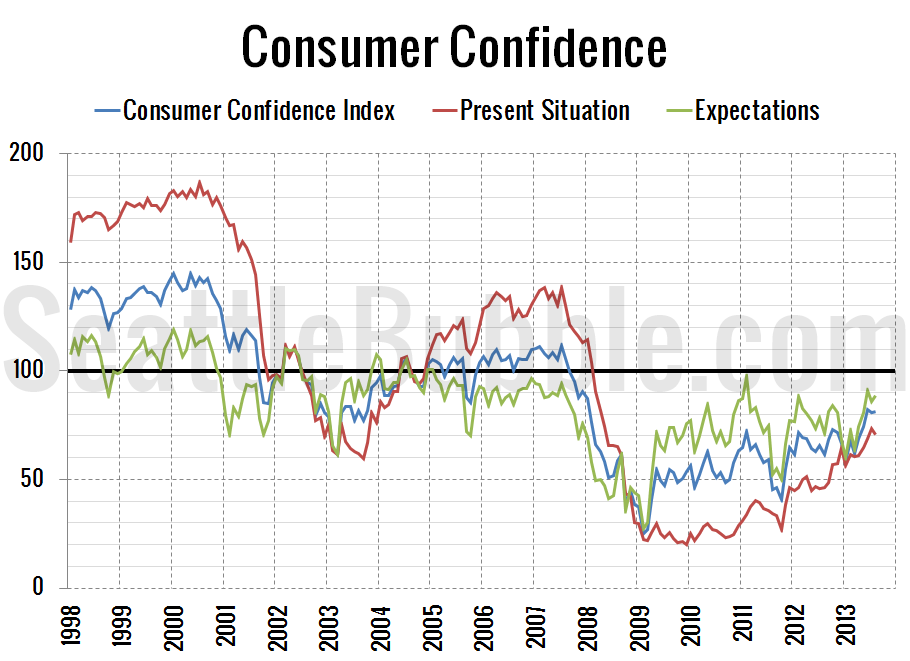
It’s time for another check in on Consumer Confidence. This time around I’m also going to throw in the latest home mortgage interest rate data, since the two are often somewhat related. First up, here’s the Consumer Confidence data as of August: At 70.7, the Present Situation Index decreased 4% between July and August, but…
NWMLS: Prices & Sales Slip While Inventory Edges Up
Although they have not yet published a press release to their website, August market stats are now available from the NWMLS. Once they post a press release I’ll update this post with a brief snippet. Until then, let’s just go straight to the stats. CAUTION NWMLS monthly reports include an undisclosed and varying number ofsales…
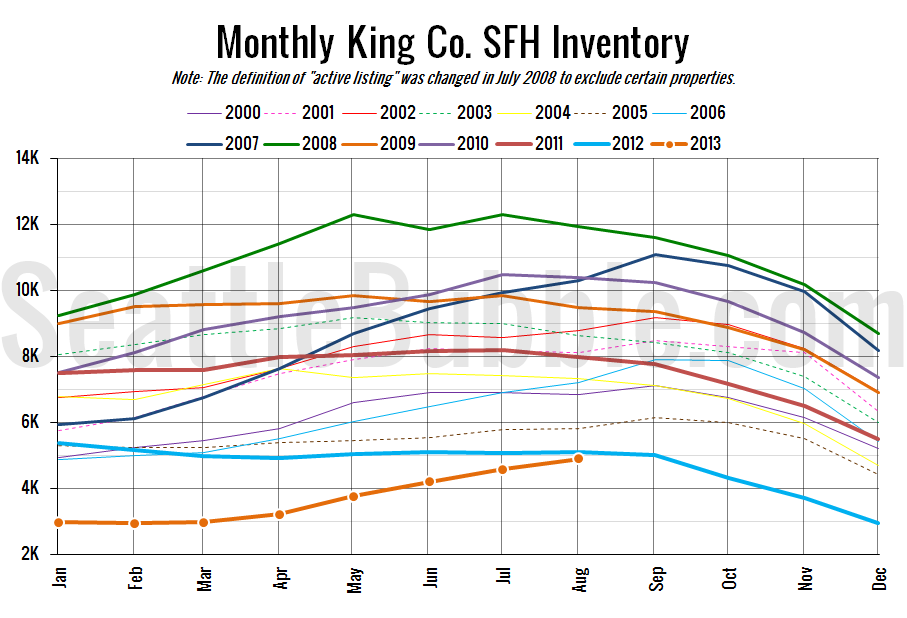
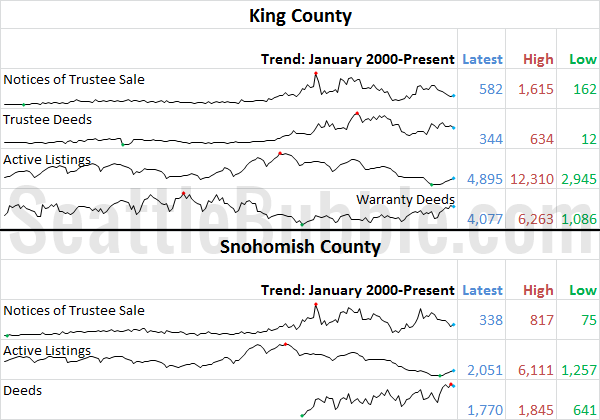
August Stats Preview: More Inventory Gains Edition
Now that the month of August is in the rear view mirror, let’s have a look at our stats preview. Most of the charts below are based on broad county-wide data that is available through a simple search of King County and Snohomish County public records. If you have additional stats you’d like to see…
Case-Shiller: Second Derivative Losses Stack Up
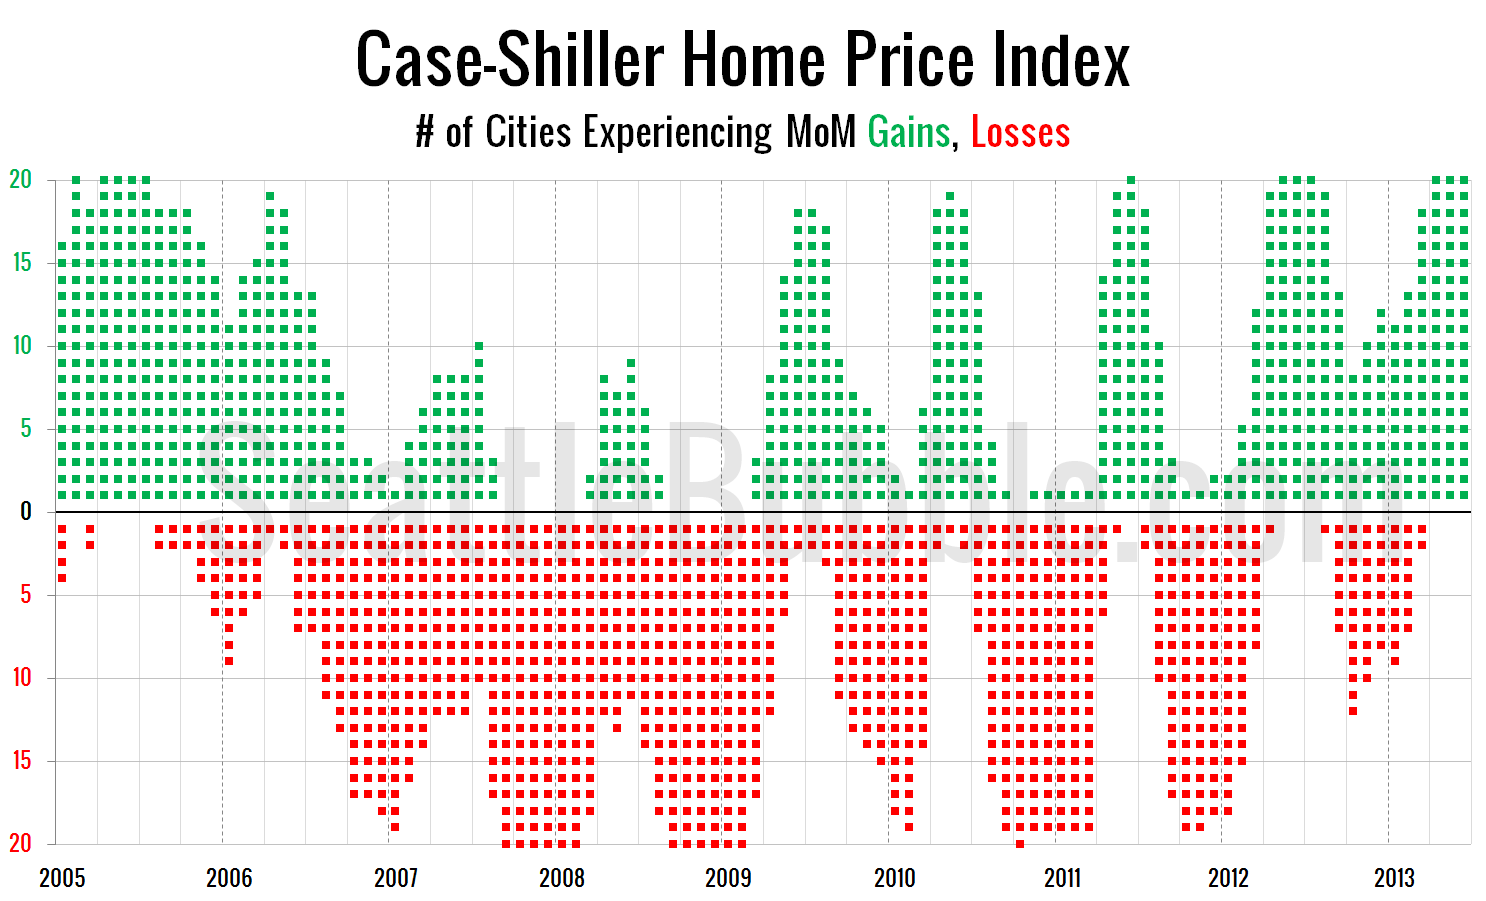
Before we put away the June Case-Shiller data, let’s have a look at my favorite alternative Case-Shiller charts. First up, let’s take a look at the twenty-city month-over-month scorecard. Here’s the original post introducing this chart if you’d like more details. Click the image below for a super-wide version with the data back through 2000….


