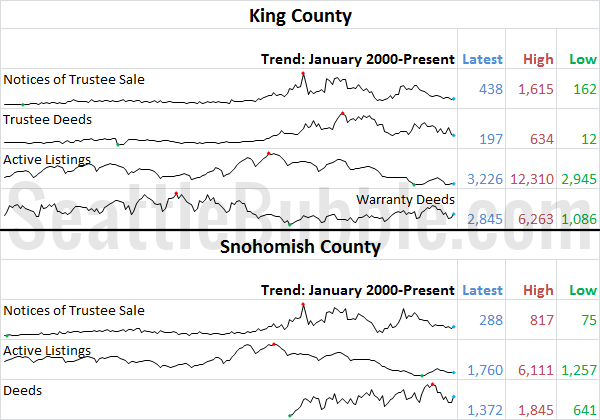
With March now behind us, let’s have a look at our monthly stats preview. Most of the charts below are based on broad county-wide data that is available through a simple search of King County and Snohomish County public records. If you have additional stats you’d like to see in the preview, drop a line…
Consumer Confidence Keeps Climbing
Let’s check in on how Consumer Confidence and mortgage interest rates fared during January. First up, here’s the Consumer Confidence data as of March: At 81.0, the Present Situation Index increased 0.7% between February and March, and is up 34% from a year earlier. The Present Situation Index is currently up 301% from its December…
Poll: Do you consider natural disasters when buying a home?
This poll was active 03.30.2014 through 04.05.2014
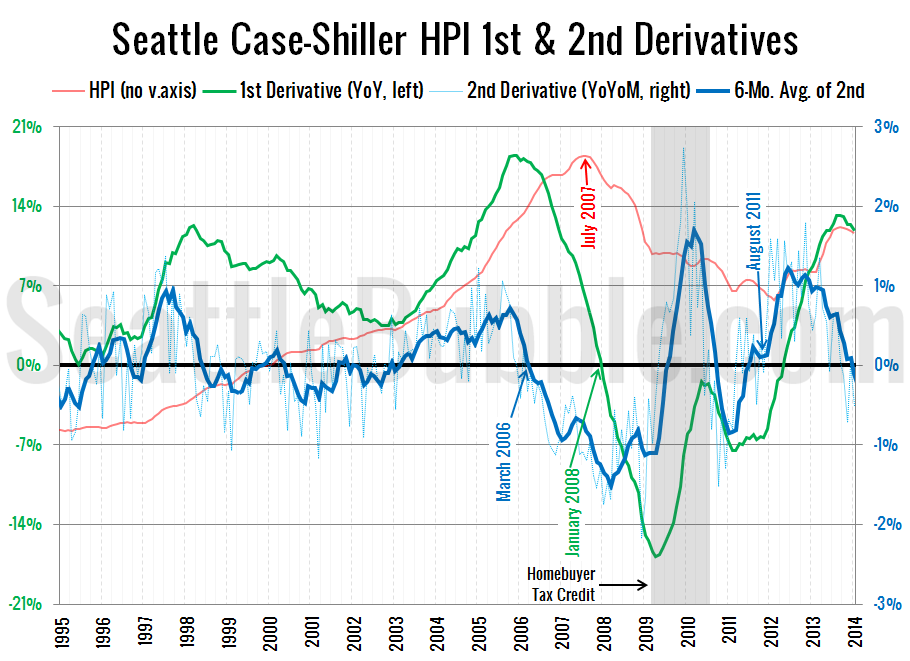
Case-Shiller Second Derivative Suggests Softer Prices
A reader requested an update to the second derivative chart of Seattle home prices, so here we go. This is a chart of the rate of change in the year-over-year change—the second derivative. For a more detailed explanation and some highlights of past inflection points, check out the original 2012 introduction of this chart. Here’s…
Case-Shiller: Home Prices Weakest Since Early 2012
Before we put away the January Case-Shiller data, let’s have a look at my favorite alternative Case-Shiller charts. First up, let’s take a look at the twenty-city month-over-month scorecard. Here’s the original post introducing this chart if you’d like more details. Click the image below for a super-wide version with the data back through 2000….