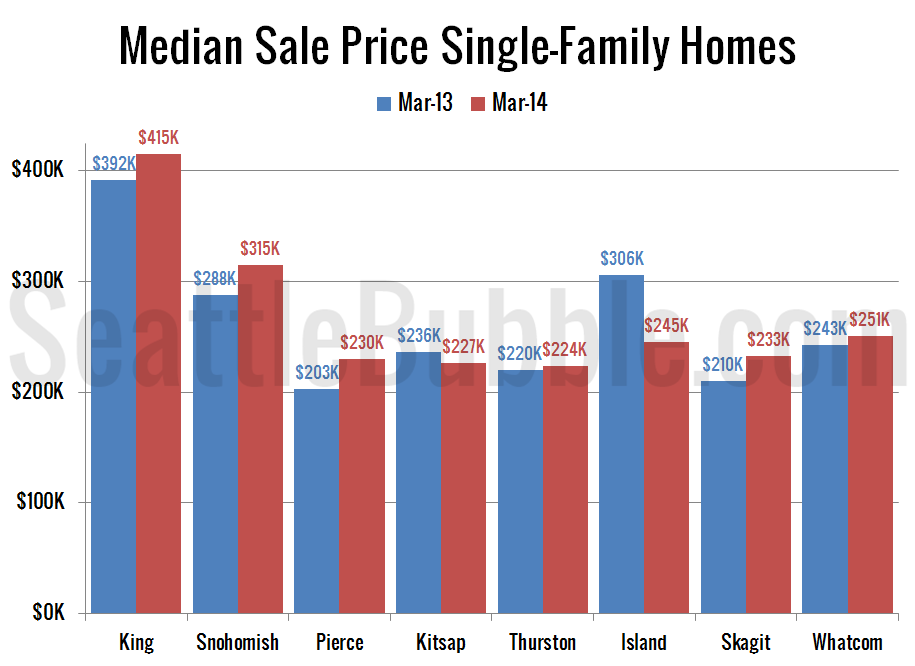
It’s time for us to check up on stats outside of the King/Snohomish core with our “Around the Sound” statistics for Pierce, Kitsap, Thurston, Island, Skagit, and Whatcom counties. If there is certain data you would like to see or ways you would like to see the data presented differently, drop a comment below and…
Poll: Would you choose to live in the Seattle area if…
This poll was active 04.20.2014 through 04.26.2014
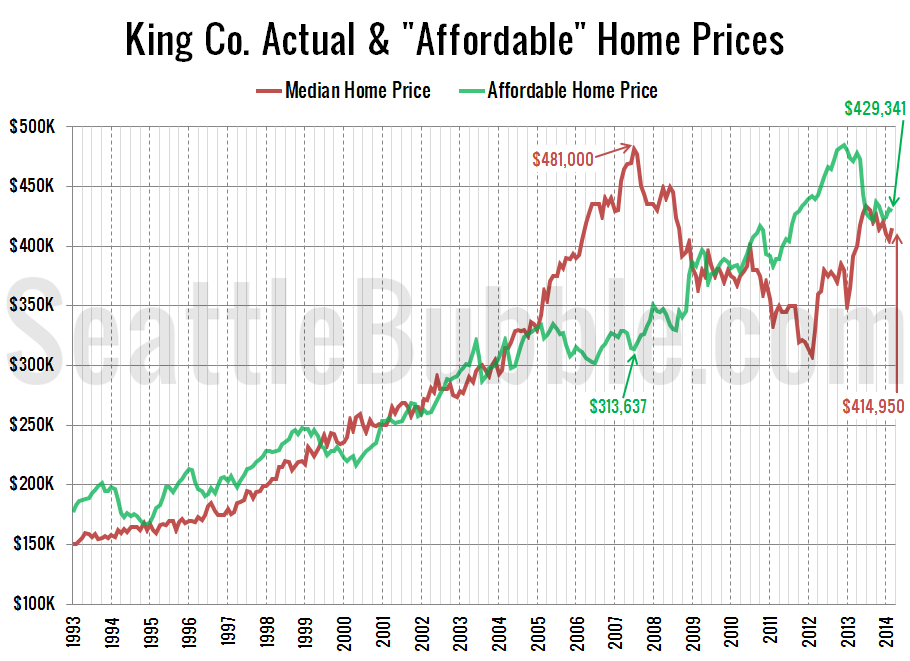
Affordable Home Price Just Above Actual Median Price
As promised in yesterday’s affordability post, here’s an updated look at the “affordable home” price chart. In this graph I flip the variables in the affordability index calculation around to other sides of the equation to calculate what price home the a family earning the median household income could afford to buy at today’s mortgage…
Affordability At Pre-Bubble Average Level
Let’s take a look at how affordability is doing in the Seattle area after the last couple months of changes in home prices and interest rates. So how does affordability look as of March? Basically on par with the long-term pre-bubble average. The index sits at 103.5, basically the same as January. An index level…
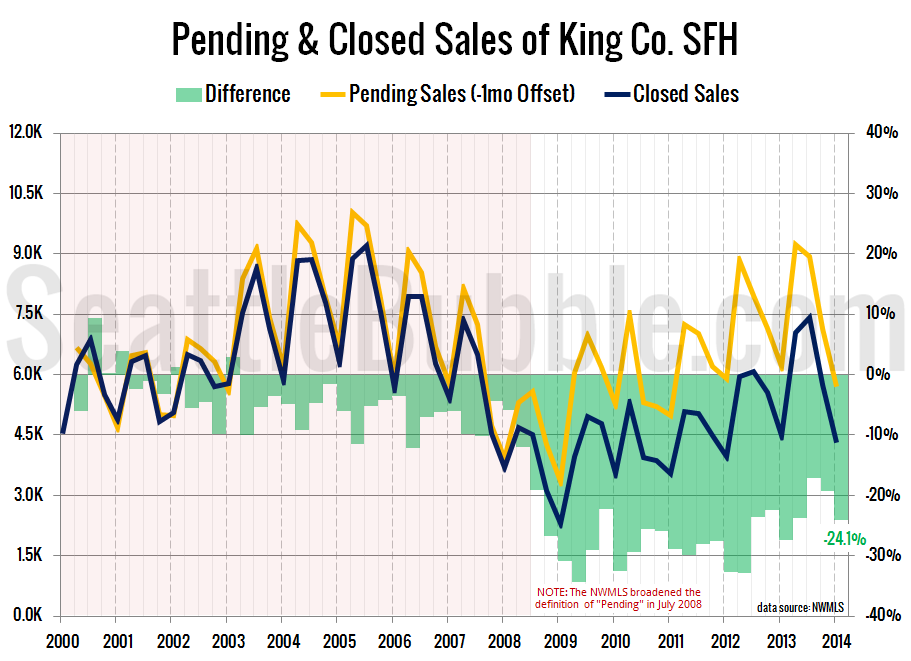
Nearly One in Four Pending Sales Did Not Close in Q1
Let’s take a look a the latest data on pending sales volume versus closed sales volume. For this series I roll the pending sales and closed sales data up by quarter, with pending sales offset by one month. In other words, the first quarter numbers below represent pending sales from December, January, and February and…