Skip to content

Seattle Bubble

local real estate news, statistics, and commentary without the sales spin.

Menu
  • Home
  • About
  • Contact
  • Reference
  • Speaking
Menu

February Stats Preview: Slow Start Edition

Posted on March 3, 2014March 3, 2014 by The Tim

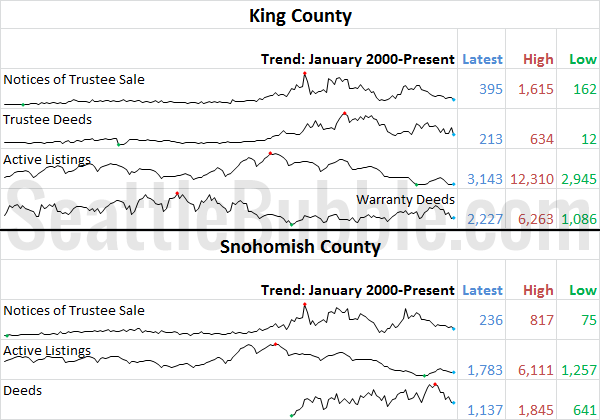
With February now complete, let’s have a look at our monthly stats preview. Most of the charts below are based on broad county-wide data that is available through a simple search of King County and Snohomish County public records. If you have additional stats you’d like to see in the preview, drop a line in…

Share:

  • Twitter
  • LinkedIn
  • Facebook
  • Reddit
  • Pinterest
  • Email

Poll: What’s the best way to invest in real estate?

Posted on March 2, 2014March 17, 2014 by The Tim

This poll was active 03.02.2014 through 03.08.2014

Share:

  • Twitter
  • LinkedIn
  • Facebook
  • Reddit
  • Pinterest
  • Email

Link Roundup: Housing Market Strength Evaporating

Posted on February 28, 2014February 28, 2014 by The Tim

It’s been a while since I’ve posted a good link roundup, and since I’ve seen a number of related stories pop up in the last couple of weeks, I thought it was a good time for one. While the housing market was definitely on fire last year, with respect to bidding wars and home price…

Share:

  • Twitter
  • LinkedIn
  • Facebook
  • Reddit
  • Pinterest
  • Email

Undervalued to Overvalued in Less Than a Year

Posted on February 27, 2014February 27, 2014 by The Tim

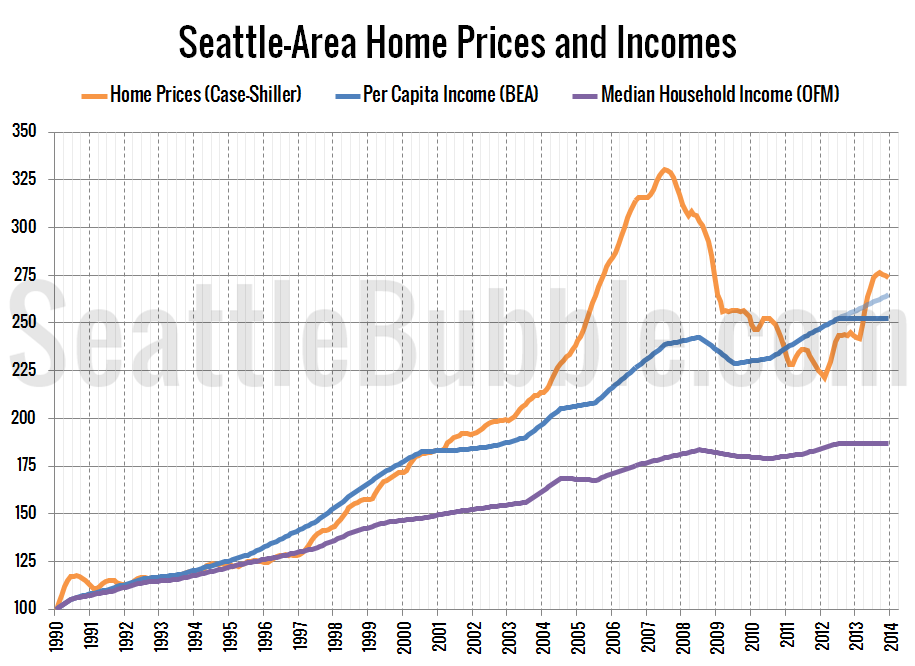
Local home prices gone from undervalued to overvalued in just a year. In January 2013, Seattle-area home prices as measured by the Case-Shiller Home Price Index were four or five percent below where local per capita incomes would suggest they should have been and one percent below where rents suggested. By December 2013, massive gains…

Share:

  • Twitter
  • LinkedIn
  • Facebook
  • Reddit
  • Pinterest
  • Email

Case-Shiller Tiers: Low Tier Dripped Most in December

Posted on February 26, 2014February 26, 2014 by The Tim

Let’s check out the three price tiers for the Seattle area, as measured by Case-Shiller. Remember, Case-Shiller’s “Seattle” data is based on single-family home repeat sales in King, Pierce, and Snohomish counties. Note that the tiers are determined by sale volume. In other words, 1/3 of all sales fall into each tier. For more details…
Share:

  • Twitter
  • LinkedIn
  • Facebook
  • Reddit
  • Pinterest
  • Email

Posts navigation

  • Previous
  • 1
  • …
  • 102
  • 103
  • 104
  • 105
  • 106
  • 107
  • 108
  • …
  • 717
  • Next

Tim’s Other Projects

Dispatches from the Multiverse

Current Market Stats

Charts courtesy Altos Research
Real Estate Market Chart by Altos Research www.altosresearch.com

Real Estate Market Chart by Altos Research www.altosresearch.com

Real Estate Market Chart by Altos Research www.altosresearch.com

Real Estate Market Chart by Altos Research www.altosresearch.com

News Categories

  • News (1,253)
    • Local (223)
    • National (46)
    • International (1)
    • Audio & Video (60)
    • Humor (43)
    • Opinion (88)
    • Uncategorized (314)
  • Features (558)
  • Statistics (1,109)
    • Counties (724)
    • Neighborhoods (100)
  • Economy (74)
  • Extras (491)
    • Polls (381)
    • Flickr Group (1)
    • Announcements (38)
    • Administrative (78)

Archives

Tip Jar

Like what we're doing?

Drop us a tip!

Accounts

  • Log in
  • Entries feed
  • Comments feed
  • WordPress.org
©2024 Seattle Bubble | Built using WordPress and Responsive Blogily theme by Superb