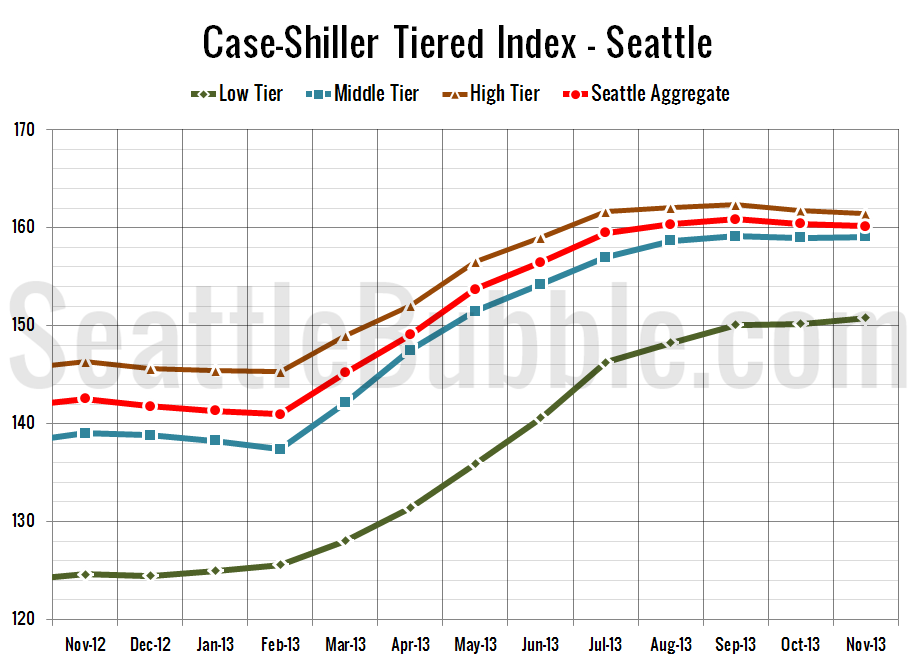
Let’s check out the three price tiers for the Seattle area, as measured by Case-Shiller. Remember, Case-Shiller’s “Seattle” data is based on single-family home repeat sales in King, Pierce, and Snohomish counties. Note that the tiers are determined by sale volume. In other words, 1/3 of all sales fall into each tier. For more details…
Case-Shiller: Seattle Home Prices Slip in November
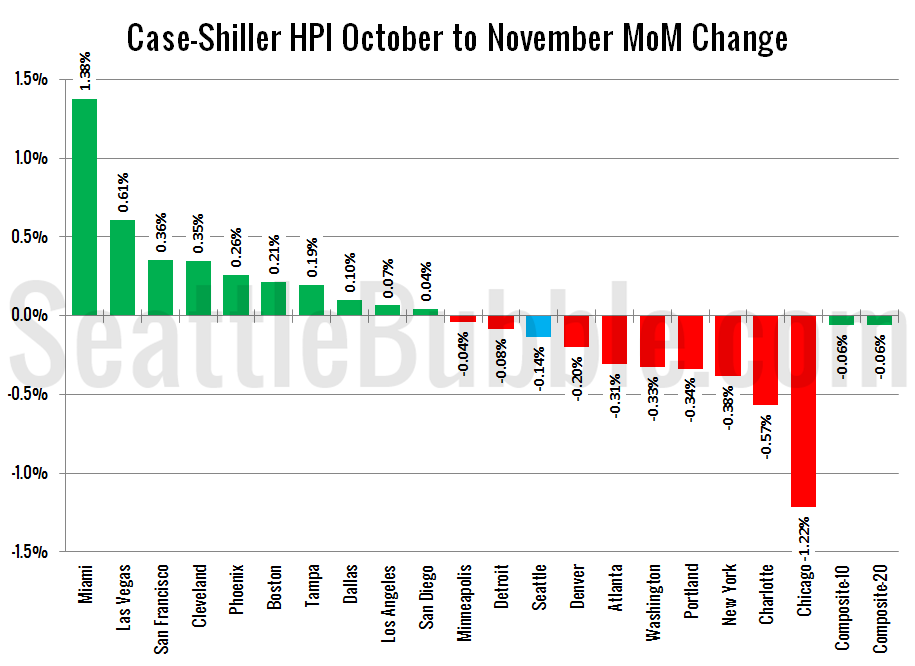
Let’s have a look at the latest data from the Case-Shiller Home Price Index. According to November data, Seattle-area home prices were: Down 0.1% October to November Up 12.4% YOY. Down 16.7% from the July 2007 peak Last year prices rose 0.5% from October to November and year-over-year prices were up 7.4%. Home prices in…
Poll: My Super Bowl Prediction:
This poll was active 01.26.2014 through 02.01.2014
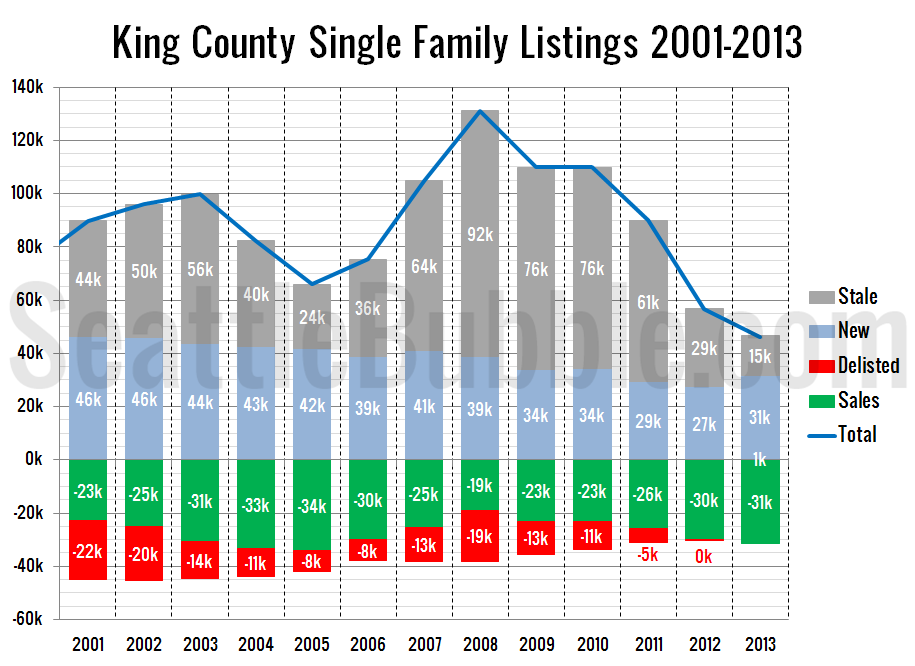
Listing Quantity Improving at 2013 Year’s End
Let’s take a closer look at how listings did over the last few months of 2013 and for the year as a whole. First up, let’s take a look at our yearly summary. In theory the number of homes that are delisted should always show up as a negative number on this chart, but a…
Real Actual Listing Photos: Home Still in Beta
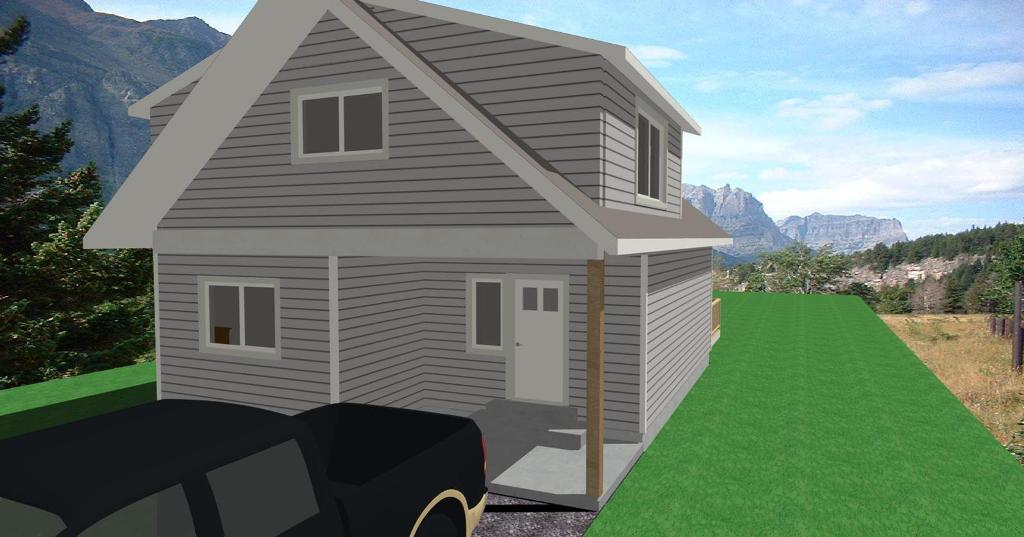
It’s time for another installment of Real Actual Listing Photos. Once a month (or so) I round up some of the most bizarre listing photos from around the Seattle area and post them here, with brief excerpts from the real actual listing description, and probably a bit of snarky commentary. Our favorite crazy listing site…