Skip to content

Seattle Bubble

local real estate news, statistics, and commentary without the sales spin.

Menu
  • Home
  • About
  • Contact
  • Reference
  • Speaking
Menu

Inventory Growth in 2013 is the Strongest Since 2008

Posted on July 17, 2013 by The Tim

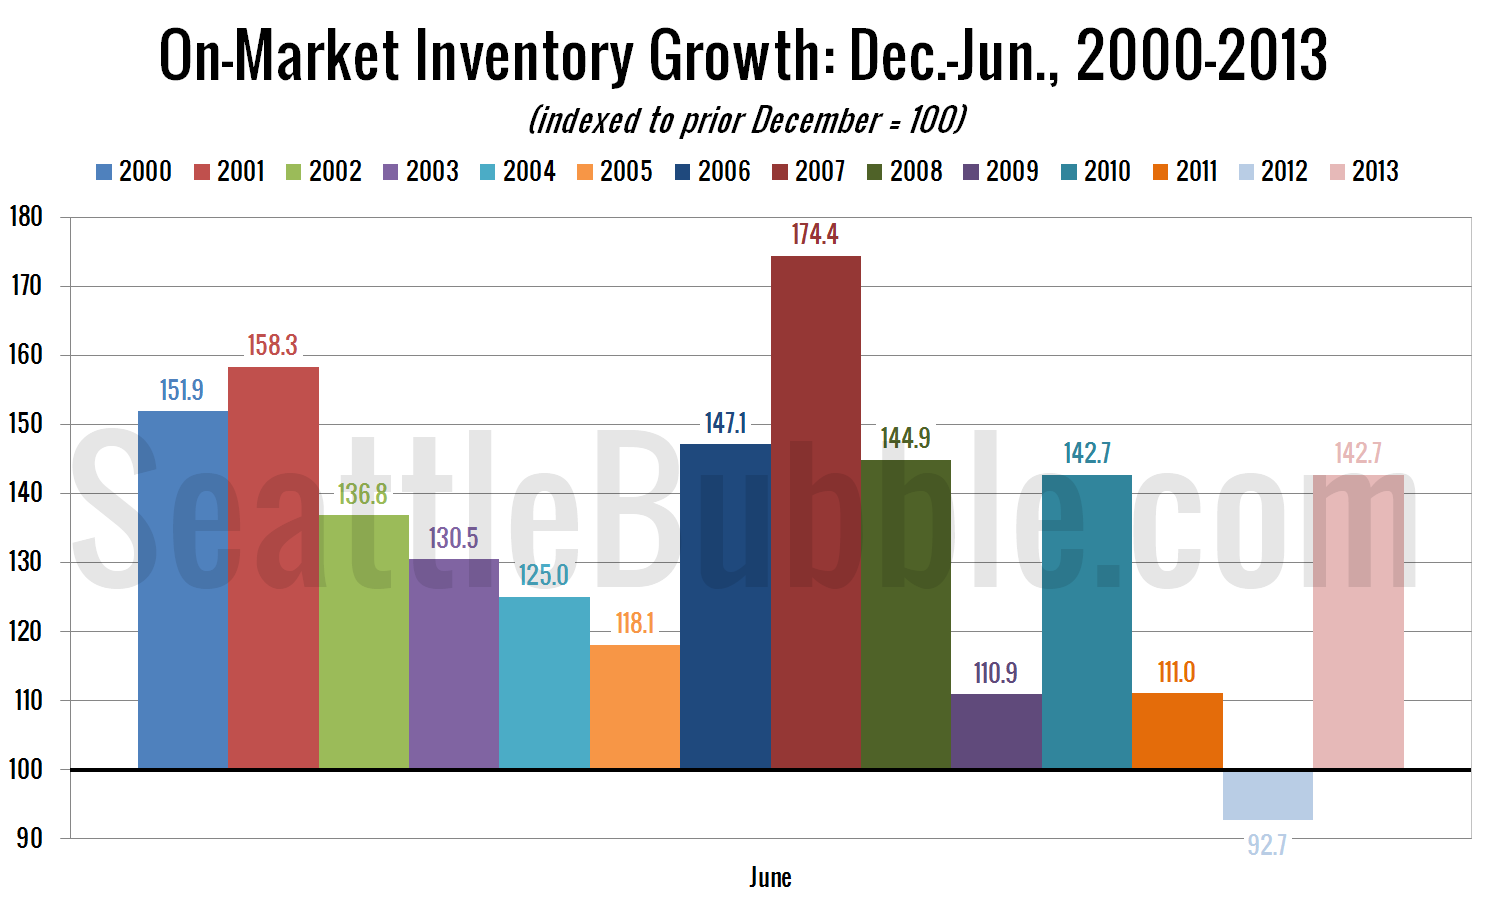
Although total active inventory is still near record lows, here’s some good news: inventory growth so far in 2013 is the best we’ve seen since 2008: As of the end of June there were 42.72% more listings on the market than there were at the beginning of the year. That just barely edges out the…

Share:

  • Twitter
  • LinkedIn
  • Facebook
  • Reddit
  • Pinterest
  • Email

South King County Homes Gaining Value Fastest

Posted on July 15, 2013July 15, 2013 by The Tim

As promised last week, it’s time to take an updated look at how King County’s sales are shifting between the different regions around the county, since geographic shifts can and do affect the median price. In order to explore this concept, we break King County down into three regions, based on the NWMLS-defined “areas”: low…

Share:

  • Twitter
  • LinkedIn
  • Facebook
  • Reddit
  • Pinterest
  • Email

Poll: Which will be the best investment over the next 10 years?

Posted on July 14, 2013July 21, 2013 by The Tim

This poll was active 07.14.2013 through 07.20.2013

Share:

  • Twitter
  • LinkedIn
  • Facebook
  • Reddit
  • Pinterest
  • Email

Non-Distressed Median Price Surged Again in June

Posted on July 12, 2013July 12, 2013 by The Tim

As promised earlier this week, it’s time to check up on median home sale prices broken down by distress status: Non-distressed, bank-owned, and short sales. As of June, the non-distressed median price for King County single family home sales sits at $460,000, up 7.0% from a year earlier and up 4.3% from May. Last year…

Share:

  • Twitter
  • LinkedIn
  • Facebook
  • Reddit
  • Pinterest
  • Email

Foreclosures Fall Below 2012 Levels in King & Snohomish

Posted on July 11, 2013July 11, 2013 by The Tim

It’s time for our detailed look at June’s foreclosure stats in King, Snohomish, and Pierce counties. First up, the Notice of Trustee Sale summary: June 2013 King: 584 NTS, down 9% YOY Snohomish: 349 NTS, down 10% YOY Pierce: 506 NTS, up 24% YOY Just as predicted, we’ve started to flip to year-over-year declines. This…

Share:

  • Twitter
  • LinkedIn
  • Facebook
  • Reddit
  • Pinterest
  • Email

Posts navigation

  • Previous
  • 1
  • …
  • 135
  • 136
  • 137
  • 138
  • 139
  • 140
  • 141
  • …
  • 717
  • Next

Tim’s Other Projects

Dispatches from the Multiverse

Current Market Stats

Charts courtesy Altos Research
Real Estate Market Chart by Altos Research www.altosresearch.com

Real Estate Market Chart by Altos Research www.altosresearch.com

Real Estate Market Chart by Altos Research www.altosresearch.com

Real Estate Market Chart by Altos Research www.altosresearch.com

News Categories

  • News (1,253)
    • Local (223)
    • National (46)
    • International (1)
    • Audio & Video (60)
    • Humor (43)
    • Opinion (88)
    • Uncategorized (314)
  • Features (558)
  • Statistics (1,109)
    • Counties (724)
    • Neighborhoods (100)
  • Economy (74)
  • Extras (491)
    • Polls (381)
    • Flickr Group (1)
    • Announcements (38)
    • Administrative (78)

Archives

Tip Jar

Like what we're doing?

Drop us a tip!

Accounts

  • Log in
  • Entries feed
  • Comments feed
  • WordPress.org
©2024 Seattle Bubble | Built using WordPress and Responsive Blogily theme by Superb