Skip to content

Seattle Bubble

local real estate news, statistics, and commentary without the sales spin.

Menu
  • Home
  • About
  • Contact
  • Reference
  • Speaking
Menu

Weekly Twitter Digest (Link Roundup) for 2013-05-03

Posted on May 4, 2013 by The Tim

RT @NickTimiraos: This chart puts the housing 'recovery' in context, ie., when a 23% price gain means you're still down by 44% http://t.co/… -> RT @NickTimiraos: The housing market: everyone wants to buy at the bottom, but few want to sell http://t.co/jTqRcWuoXY ->

Share:

  • Twitter
  • LinkedIn
  • Facebook
  • Reddit
  • Pinterest
  • Email

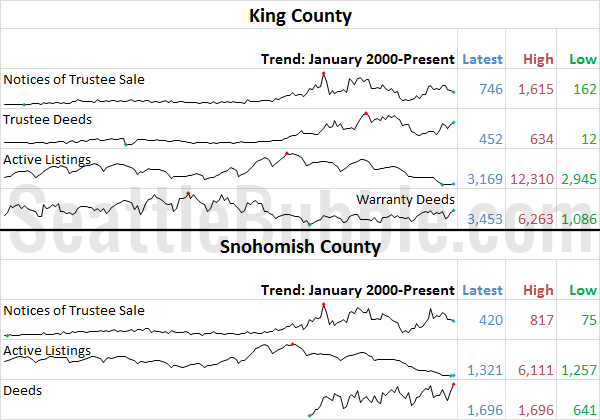
April Stats Preview: Finally Some Inventory Edition

Posted on May 2, 2013May 2, 2013 by The Tim

With April 2013 in the history books, let’s have a look at our stats preview. Most of the charts below are based on broad county-wide data that is available through a simple search of King County and Snohomish County public records. If you have additional stats you’d like to see in the preview, drop a…

Share:

  • Twitter
  • LinkedIn
  • Facebook
  • Reddit
  • Pinterest
  • Email

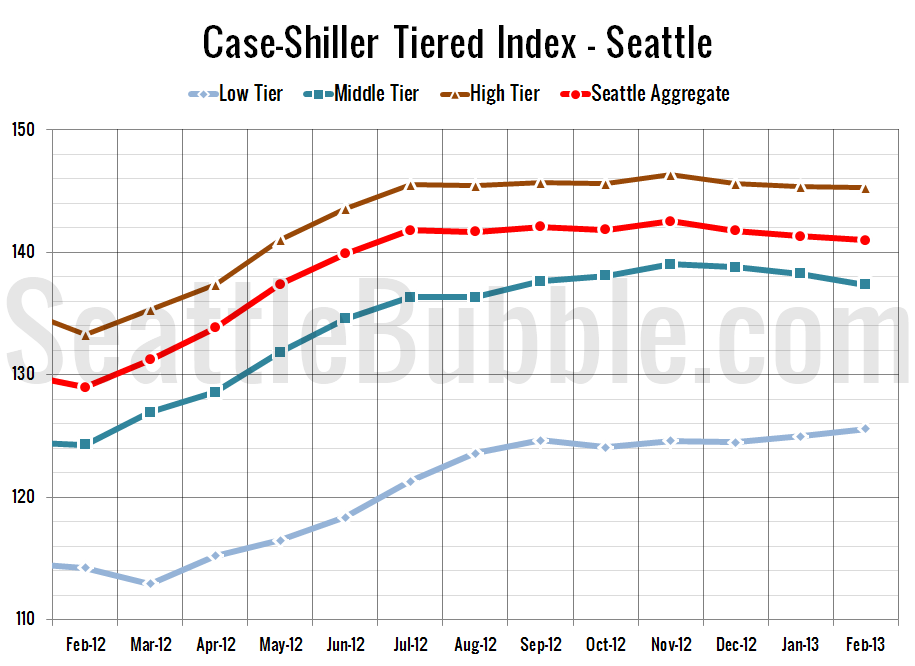
Case-Shiller Tiers: Low Tier Gains, Middle Tier Loses

Posted on May 1, 2013April 30, 2013 by The Tim

Let’s check out the three price tiers for the Seattle area, as measured by Case-Shiller. Remember, Case-Shiller’s “Seattle” data is based on single-family home repeat sales in King, Pierce, and Snohomish counties. Note that the tiers are determined by sale volume. In other words, 1/3 of all sales fall into each tier. For more details…

Share:

  • Twitter
  • LinkedIn
  • Facebook
  • Reddit
  • Pinterest
  • Email

Case-Shiller: February Home Prices Dipped Slightly

Posted on April 30, 2013April 30, 2013 by The Tim

Let’s have a look at the latest data from the Case-Shiller Home Price Index. According to February data, Seattle-area home prices were: Down 0.2% January to February Up 9.3% YOY. Down 26.7% from the July 2007 peak Last year prices fell 0.8% from January to February and year-over-year prices were down 2.9%. I was actually…

Share:

  • Twitter
  • LinkedIn
  • Facebook
  • Reddit
  • Pinterest
  • Email

Real Actual Listing Photos: Driveby, Radioactive, Timestamp

Posted on April 29, 2013April 29, 2013 by The Tim

It’s time for another installment of Real Actual Listing Photos. Once a month (or so) I round up some of the most bizarre listing photos from around the Seattle area and post them here, with brief excerpts from the real actual listing description, and probably a bit of snarky commentary. Don’t forget to check out…

Share:

  • Twitter
  • LinkedIn
  • Facebook
  • Reddit
  • Pinterest
  • Email

Posts navigation

  • Previous
  • 1
  • …
  • 148
  • 149
  • 150
  • 151
  • 152
  • 153
  • 154
  • …
  • 717
  • Next

Tim’s Other Projects

Dispatches from the Multiverse

Current Market Stats

Charts courtesy Altos Research
Real Estate Market Chart by Altos Research www.altosresearch.com

Real Estate Market Chart by Altos Research www.altosresearch.com

Real Estate Market Chart by Altos Research www.altosresearch.com

Real Estate Market Chart by Altos Research www.altosresearch.com

News Categories

  • News (1,253)
    • Local (223)
    • National (46)
    • International (1)
    • Audio & Video (60)
    • Humor (43)
    • Opinion (88)
    • Uncategorized (314)
  • Features (558)
  • Statistics (1,109)
    • Counties (724)
    • Neighborhoods (100)
  • Economy (74)
  • Extras (491)
    • Polls (381)
    • Flickr Group (1)
    • Announcements (38)
    • Administrative (78)

Archives

Tip Jar

Like what we're doing?

Drop us a tip!

Accounts

  • Log in
  • Entries feed
  • Comments feed
  • WordPress.org
©2024 Seattle Bubble | Built using WordPress and Responsive Blogily theme by Superb