Skip to content

Seattle Bubble

local real estate news, statistics, and commentary without the sales spin.

Menu
  • Home
  • About
  • Contact
  • Reference
  • Speaking
Menu

Case-Shiller Tiers: To. The. Moon.

Posted on March 28, 2018March 28, 2018 by The Tim

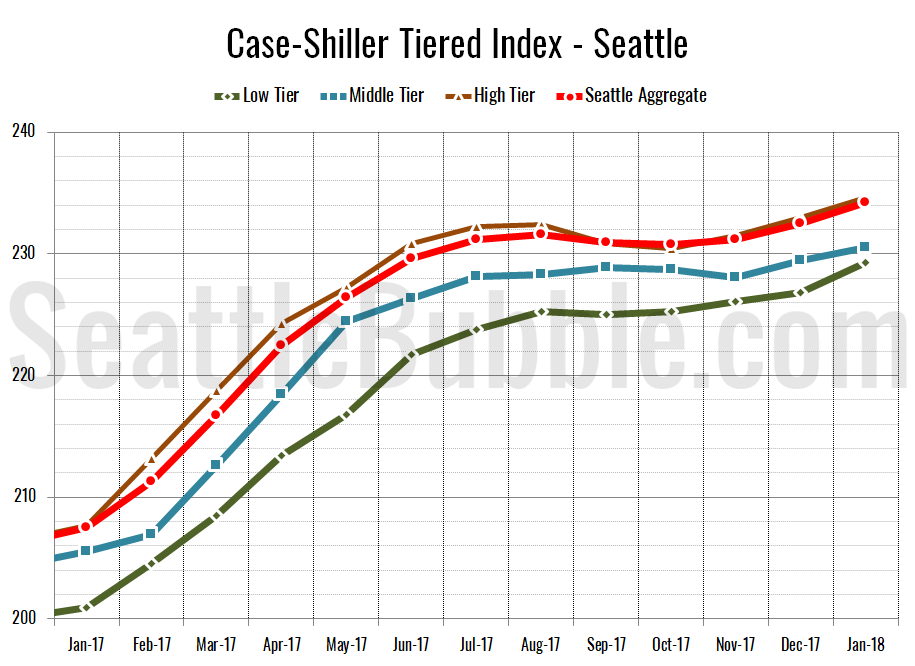
Let’s check out the three price tiers for the Seattle area, as measured by Case-Shiller. Remember, Case-Shiller’s “Seattle” data is based on single-family home repeat sales in King, Pierce, and Snohomish counties.

Note that the tiers are determined by sale volume. In other words, 1/3 of all sales fall into each tier. For more details on the tier methodologies, hit the full methodology pdf. Here are the current tier breakpoints:

  • Low Tier: < $373,070 (up 0.2%)
  • Mid Tier: $373,070 – $604,377
  • Hi Tier: > $604,377 (up 0.3%)

Share:

  • Twitter
  • LinkedIn
  • Facebook
  • Reddit
  • Pinterest
  • Email

Case-Shiller: Seattle kicks off 2018 with surging home prices

Posted on March 27, 2018March 28, 2018 by The Tim

Let’s have a look at the latest data from the Case-Shiller Home Price Index. According to January data that was released this week, Seattle-area home prices were:

Up 0.7 percent December to January
Up 12.9 percent year-over-year.
Up 21.8 percent from the July 2007 peak

Over the same period last year prices were up 0.6 percent month-over-month and year-over-year prices were up 11.3 percent.

Seattle still leads the nation in year-over-year price growth. The only other metro areas with double-digit price growth from a year earlier are Las Vegas at 11.1 percent and San Francisco at 10.3 percent.

Share:

  • Twitter
  • LinkedIn
  • Facebook
  • Reddit
  • Pinterest
  • Email

Share of sales in cheap parts of King County hit all-time high as prices keep climbing

Posted on March 22, 2018 by The Tim

It’s been nearly a year since we took a look at the in-county breakdown data from the NWMLS to see how the sales mix shifted around the county. I like to keep an eye on this not only to see how individual neighborhoods are doing but also to see how the sales mix shift affects the overall county-wide median price.
…
The most interesting thing in this data is that in February the share of sales in the South King regions hit an all-time high at 41.6 percent, just edging out the previous high of 41.4 percent set in November 2007 (just four months after prices peaked). Despite this continued shift in sales toward the lower-priced regions, the county-wide median price continues to push upward.

Share:

  • Twitter
  • LinkedIn
  • Facebook
  • Reddit
  • Pinterest
  • Email

King County median home price now $77k higher than “Affordable” home price

Posted on March 21, 2018 by The Tim

As promised in Monday’s affordability post, here’s an updated look at the “affordable home” price chart.

In this graph I flip the variables in the affordability index calculation around to other sides of the equation to calculate what price home the a family earning the median household income could “afford” to buy at today’s mortgage rates, if they spent 30% of their monthly gross income on their home payment. Don’t forget that this math includes the (giant) assumption that the home buyers putting 20% down, which would be $129,990 at today’s median price.

Share:

  • Twitter
  • LinkedIn
  • Facebook
  • Reddit
  • Pinterest
  • Email

News Brief: Seattle City Council attempts to outlaw economics

Posted on March 20, 2018March 20, 2018 by The Tim

From the Seattle Times: Seattle City Council votes to impose moratorium on rent-bidding websites

The Seattle City Council voted Monday to impose a one-year moratorium on rent-bidding platforms…

Share:

  • Twitter
  • LinkedIn
  • Facebook
  • Reddit
  • Pinterest
  • Email

Posts navigation

  • Previous
  • 1
  • …
  • 13
  • 14
  • 15
  • 16
  • 17
  • 18
  • 19
  • …
  • 717
  • Next

Tim’s Other Projects

Dispatches from the Multiverse

Current Market Stats

Charts courtesy Altos Research
Real Estate Market Chart by Altos Research www.altosresearch.com

Real Estate Market Chart by Altos Research www.altosresearch.com

Real Estate Market Chart by Altos Research www.altosresearch.com

Real Estate Market Chart by Altos Research www.altosresearch.com

News Categories

  • News (1,253)
    • Local (223)
    • National (46)
    • International (1)
    • Audio & Video (60)
    • Humor (43)
    • Opinion (88)
    • Uncategorized (314)
  • Features (558)
  • Statistics (1,109)
    • Counties (724)
    • Neighborhoods (100)
  • Economy (74)
  • Extras (491)
    • Polls (381)
    • Flickr Group (1)
    • Announcements (38)
    • Administrative (78)

Archives

Tip Jar

Like what we're doing?

Drop us a tip!

Accounts

  • Log in
  • Entries feed
  • Comments feed
  • WordPress.org
©2024 Seattle Bubble | Built using WordPress and Responsive Blogily theme by Superb
Menu
  • Home
  • About
  • Contact
  • Reference
  • Speaking