Skip to content

Seattle Bubble

local real estate news, statistics, and commentary without the sales spin.

Menu
  • Home
  • About
  • Contact
  • Reference
  • Speaking
Menu

Top 10 Most-Commented Posts of 2012

Posted on December 31, 2012December 31, 2012 by The Tim

This week is getting off to a slow start thanks to the holiday, so like last year I’ll be posting a few “filler” items like this one. First up, the top ten most-commented posts of 2012, excluding open threads. 128 comments, 01/03: December Stats Preview: Inventory Erasure Edition 131 comments, 02/24: Buy vs. Rent: A…

Share:

  • Twitter
  • LinkedIn
  • Facebook
  • Reddit
  • Pinterest
  • Email

Poll: King County SFH inventory will ____ between now and the end of January.

Posted on December 30, 2012January 6, 2013 by The Tim

This poll was active 12.30.2012 through 01.05.2013

Share:

  • Twitter
  • LinkedIn
  • Facebook
  • Reddit
  • Pinterest
  • Email

Weekly Twitter Digest (Link Roundup) for 2012-12-28

Posted on December 29, 2012 by The Tim

Nice. Spotted by a reader, Czech Sky appears in a Lennar web ad: http://t.co/2E48NLuf -> RT @seatimesbiz Seattle area sees surge in new homes http://t.co/ewLcFbKk -> Claim: "Chinese buyers snapping up Seattle area luxury homes and condos" http://t.co/iyY8fsUT via @PSBJ ->

Share:

  • Twitter
  • LinkedIn
  • Facebook
  • Reddit
  • Pinterest
  • Email

Case-Shiller Tiers: High & Low Tier Begin Seasonal Decline

Posted on December 27, 2012 by The Tim

Let’s check out the three price tiers for the Seattle area, as measured by Case-Shiller. Remember, Case-Shiller’s “Seattle” data is based on single-family home repeat sales in King, Pierce, and Snohomish counties. Note that the tiers are determined by sale volume. In other words, 1/3 of all sales fall into each tier. For more details…

Share:

  • Twitter
  • LinkedIn
  • Facebook
  • Reddit
  • Pinterest
  • Email

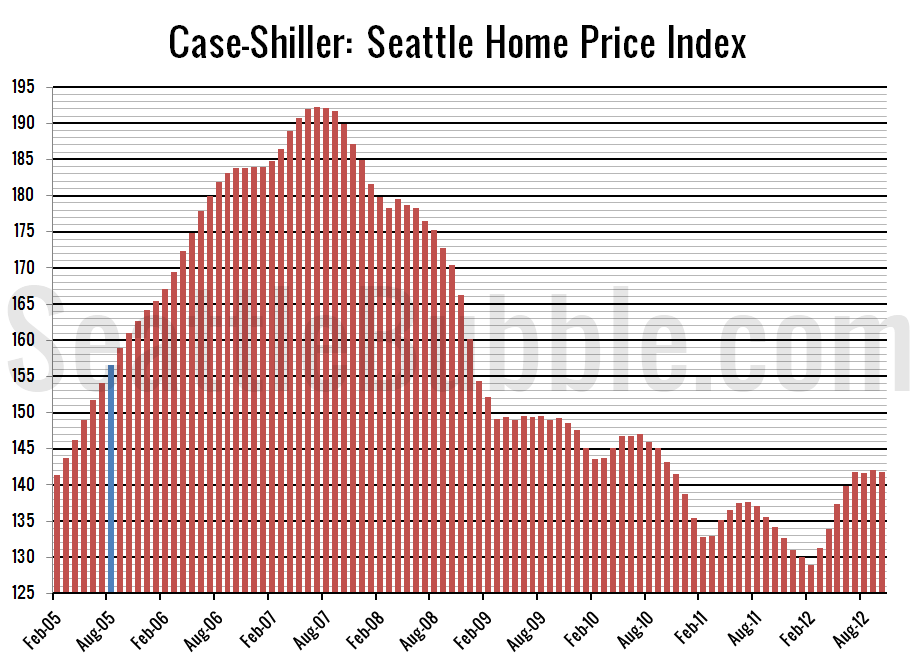
Case-Shiller: Yearly Price Gain Increased Again in October

Posted on December 26, 2012 by The Tim

Let’s have a look at the latest data from the Case-Shiller Home Price Index. According to October data, Seattle-area home prices were: Down 0.2% September to October. Up 5.7% YOY. Down 26.3% from the July 2007 peak Last year prices fell 1.0% from September to October and year-over-year prices were down 6.2%. Nothing surprising here….

Share:

  • Twitter
  • LinkedIn
  • Facebook
  • Reddit
  • Pinterest
  • Email

Posts navigation

  • Previous
  • 1
  • …
  • 172
  • 173
  • 174
  • 175
  • 176
  • 177
  • 178
  • …
  • 717
  • Next

Tim’s Other Projects

Dispatches from the Multiverse

Current Market Stats

Charts courtesy Altos Research
Real Estate Market Chart by Altos Research www.altosresearch.com

Real Estate Market Chart by Altos Research www.altosresearch.com

Real Estate Market Chart by Altos Research www.altosresearch.com

Real Estate Market Chart by Altos Research www.altosresearch.com

News Categories

  • News (1,253)
    • Local (223)
    • National (46)
    • International (1)
    • Audio & Video (60)
    • Humor (43)
    • Opinion (88)
    • Uncategorized (314)
  • Features (558)
  • Statistics (1,109)
    • Counties (724)
    • Neighborhoods (100)
  • Economy (74)
  • Extras (491)
    • Polls (381)
    • Flickr Group (1)
    • Announcements (38)
    • Administrative (78)

Archives

Tip Jar

Like what we're doing?

Drop us a tip!

Accounts

  • Log in
  • Entries feed
  • Comments feed
  • WordPress.org
©2024 Seattle Bubble | Built using WordPress and Responsive Blogily theme by Superb