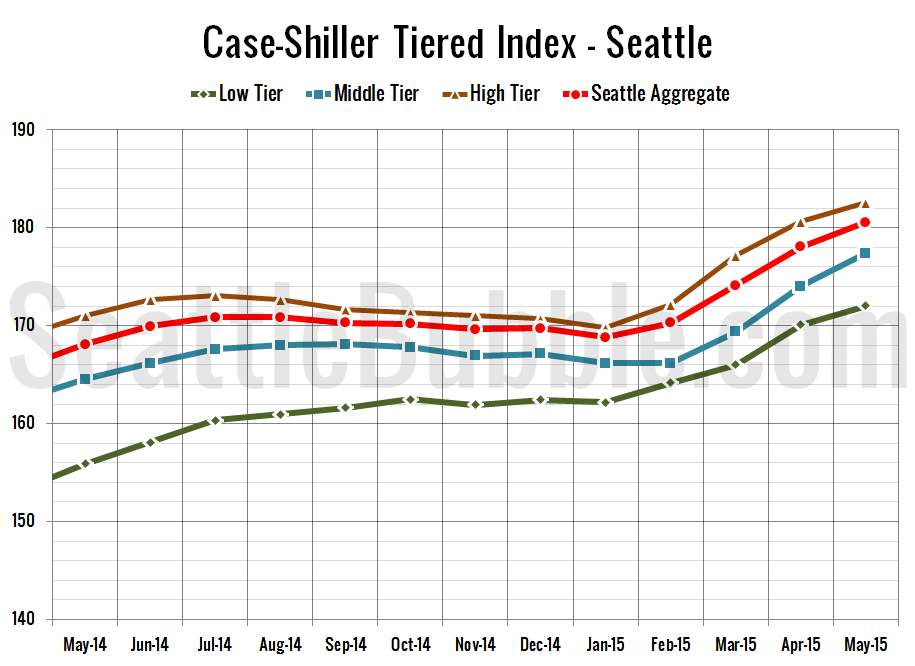
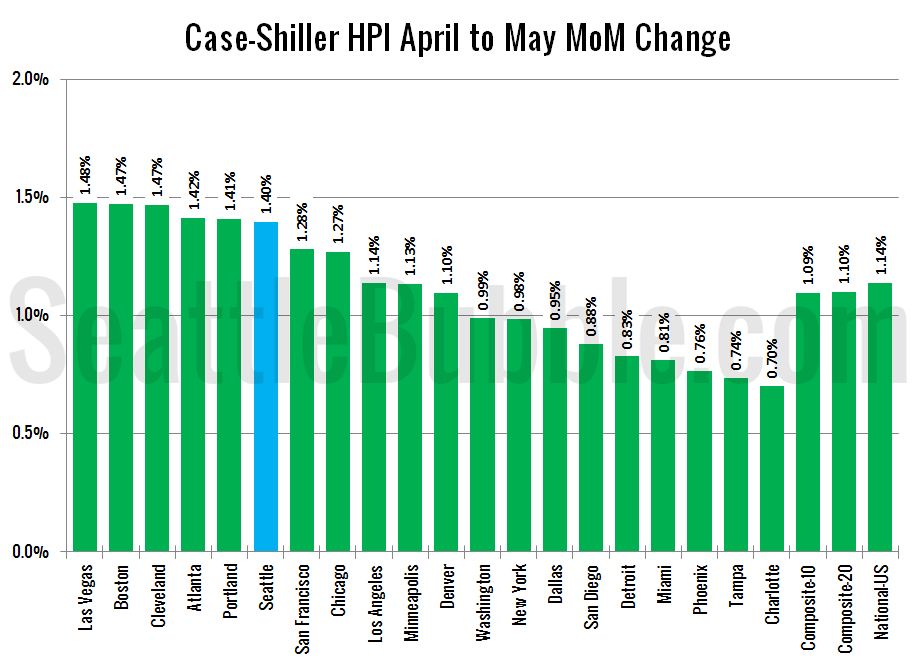
Let’s have a look at the latest data from the Case-Shiller Home Price Index. According to April data, Seattle-area home prices were: Up 1.4% April to May Up 7.4% YOY. Down 6.1% from the July 2007 peak Last year at this time prices rose 1.4% month-over-month and year-over-year prices were up 9.3%. The Seattle area’s…
Scammy Real Estate Ads Back in Force
Here’s yet another sign that we’re back in bubble territory, albeit a strictly anecdotal one. During the last bubble it was nearly impossible to turn on the radio without hearing some form of scammy “riches in flipping” ad during the commercial break. I don’t listen to the radio that often, but in the rare instances…
Price to Income Ratio Back in Bubble Territory
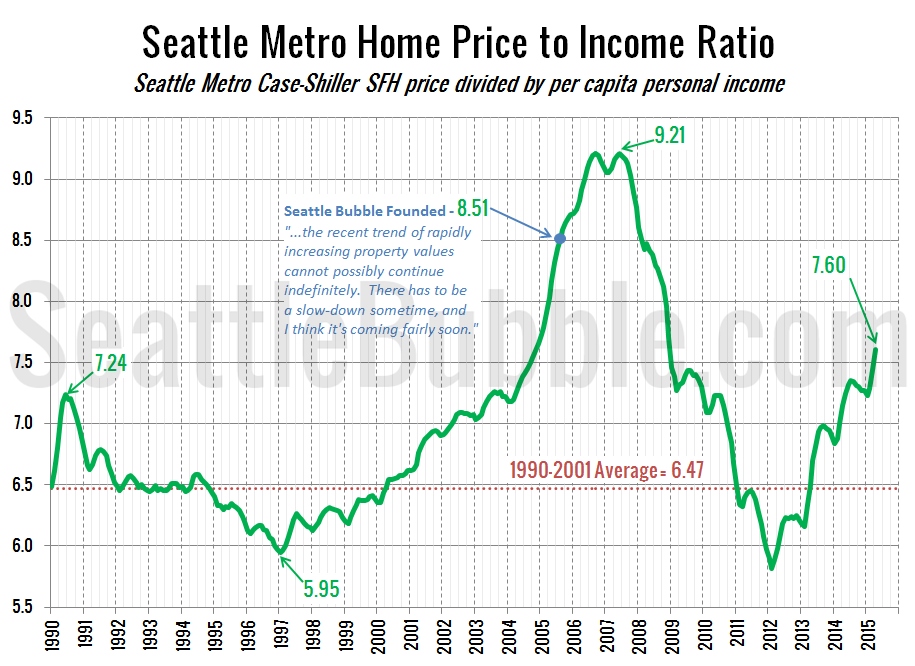
It has been a while since we last looked at one of our primary housing bubble metrics: local home prices compared to incomes. In the next chart I am using the Case-Shiller Home Price Index for the Seattle area (which rolls together King, Snohomish, and Pierce counties) and Bureau of Economic Analysis data on per…
Seattle-Area Unemployment Dips to Previous Boom Levels
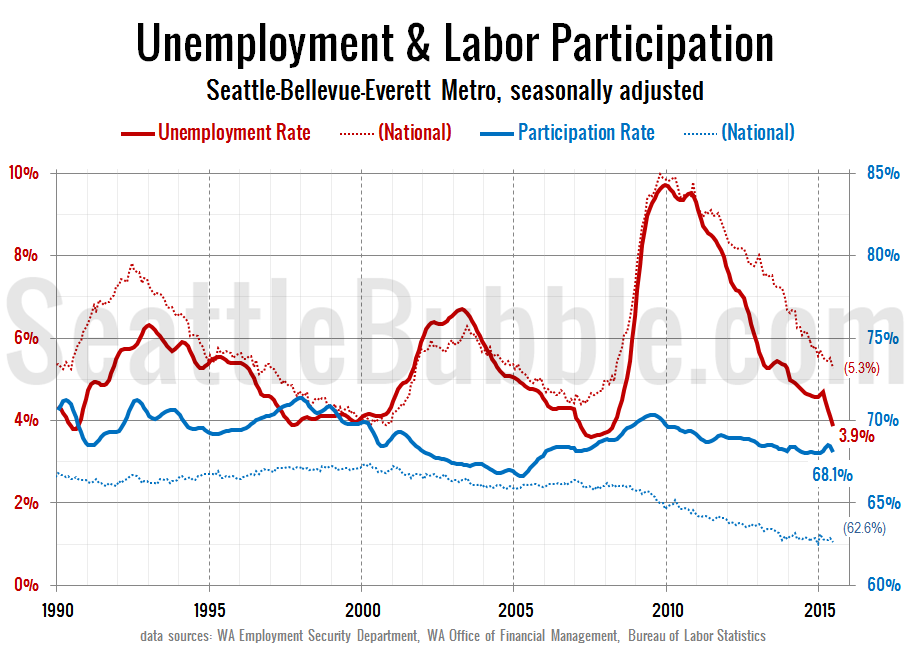
We haven’t taken a look at the jobs data in a while, so lets update those charts through June. In this series we look at how the Seattle area’s unemployment rate and approximate labor participation rate stack up to the national numbers. [July 24 Update – The chart above and numbers below have been updated…
Despite Red-Hot Housing Market, One in Five Pending Sales Still Fail to Close
With another quarter fully in the books, let’s take a look a the latest data on pending sales volume versus closed sales volume. For this series I roll the pending sales and closed sales data up by quarter, with pending sales offset by one month. In other words, the second quarter numbers below represent pending…