Skip to content

Seattle Bubble

local real estate news, statistics, and commentary without the sales spin.

Menu
  • Home
  • About
  • Contact
  • Reference
  • Speaking
Menu

Expensive Eastside Sales Surged in July

Posted on August 19, 2014August 19, 2014 by The Tim

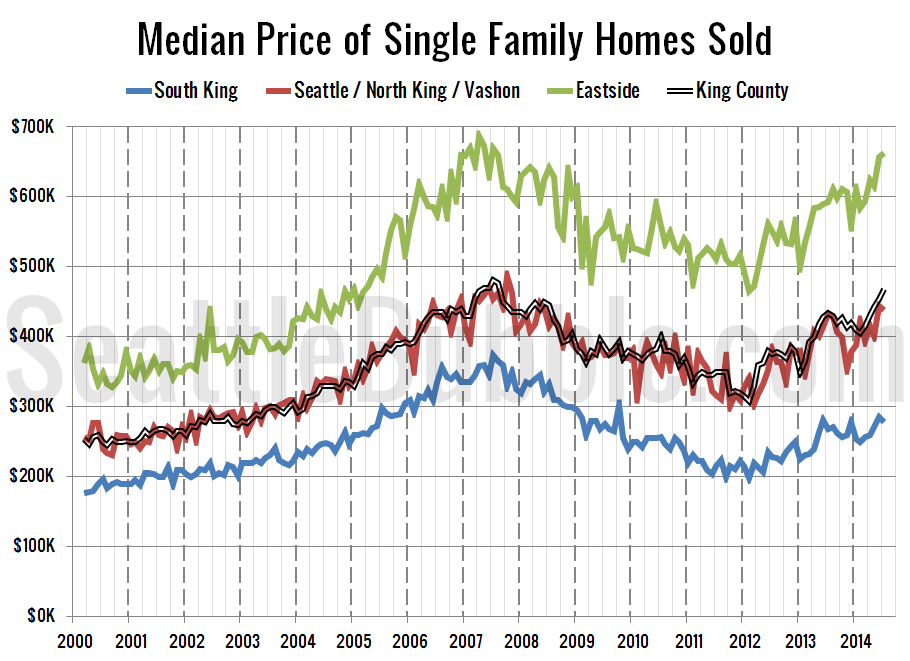
It’s time once again to take an updated look at how King County’s sales are shifting between the different regions around the county, since geographic shifts can and do affect the median price. In order to explore this concept, we break King County down into three regions, based on the NWMLS-defined “areas”: low end: South…

Share:

  • Twitter
  • LinkedIn
  • Facebook
  • Reddit
  • Pinterest
  • Email

Poll: Are We In Another Housing Bubble?

Posted on August 17, 2014August 25, 2014 by The Tim

This poll was active 08.17.2014 through 08.23.2014

Share:

  • Twitter
  • LinkedIn
  • Facebook
  • Reddit
  • Pinterest
  • Email

Another Bubble? Affordability Only Sustained By Low Rates

Posted on August 14, 2014August 14, 2014 by The Tim

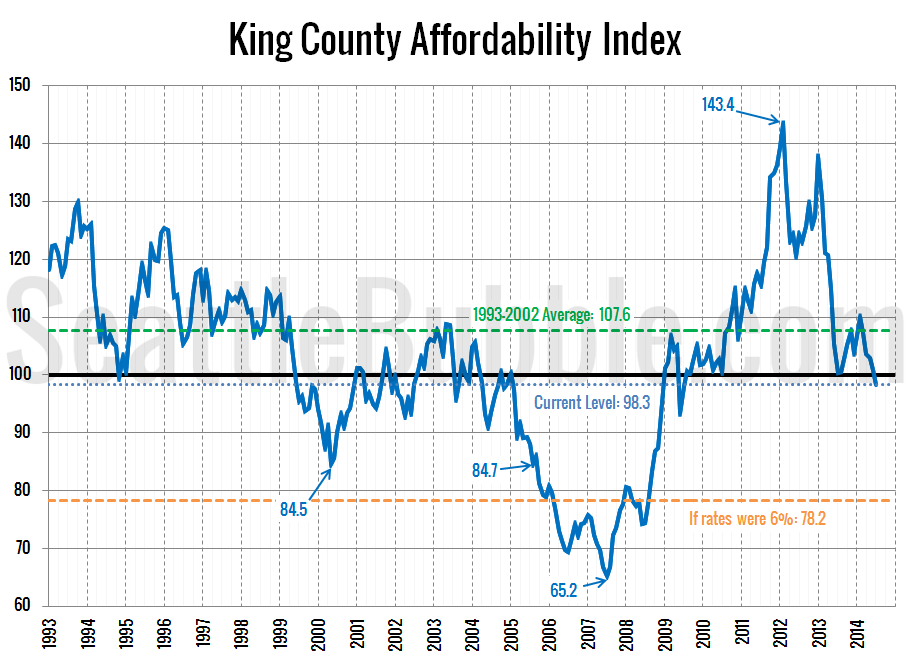
Continuing our “Another Bubble?” series, it’s time to take a look at the affordability index. As King County’s median home price has surged from $405,400 in February to $468,000 in July, the affordability index has dropped from slightly above the long-term average to just below 100. An index level above 100 indicates that the monthly…

Share:

  • Twitter
  • LinkedIn
  • Facebook
  • Reddit
  • Pinterest
  • Email

Another Bubble? Home Prices Rapidly Outgain Incomes

Posted on August 13, 2014August 13, 2014 by The Tim

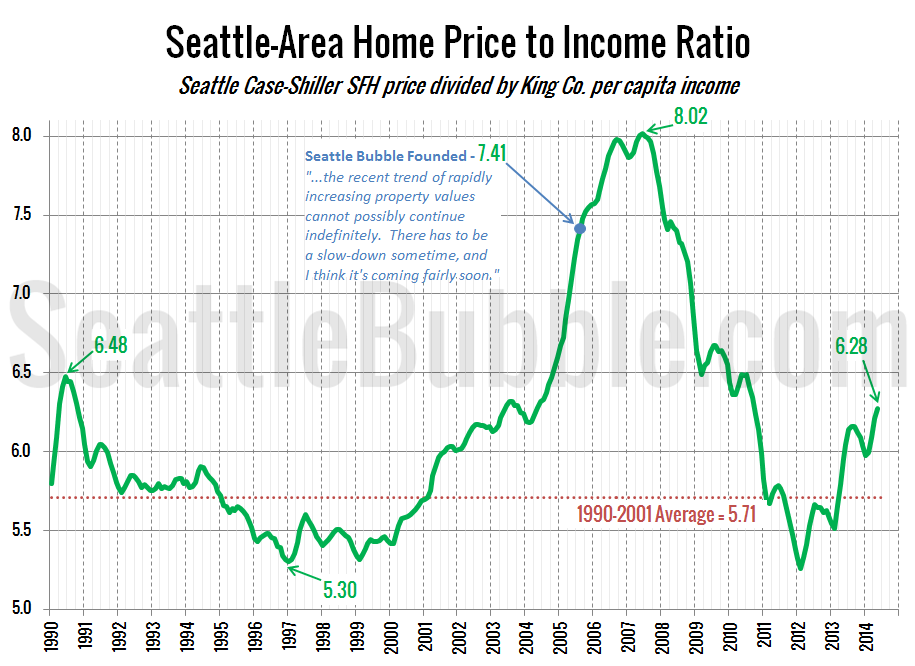
Continuing the “Another Bubble?” series we began yesterday, let’s take a look at another housing bubble metric: home prices compared to incomes. For this post I’ll be using the Case-Shiller Home Price Index for the Seattle area (which rolls together King, Snohomish, and Pierce counties) and Bureau of Economic Analysis data on per capita incomes…

Share:

  • Twitter
  • LinkedIn
  • Facebook
  • Reddit
  • Pinterest
  • Email

Another Real Estate Bubble? Price to Rent Ratio Shoots Up

Posted on August 12, 2014August 13, 2014 by The Tim

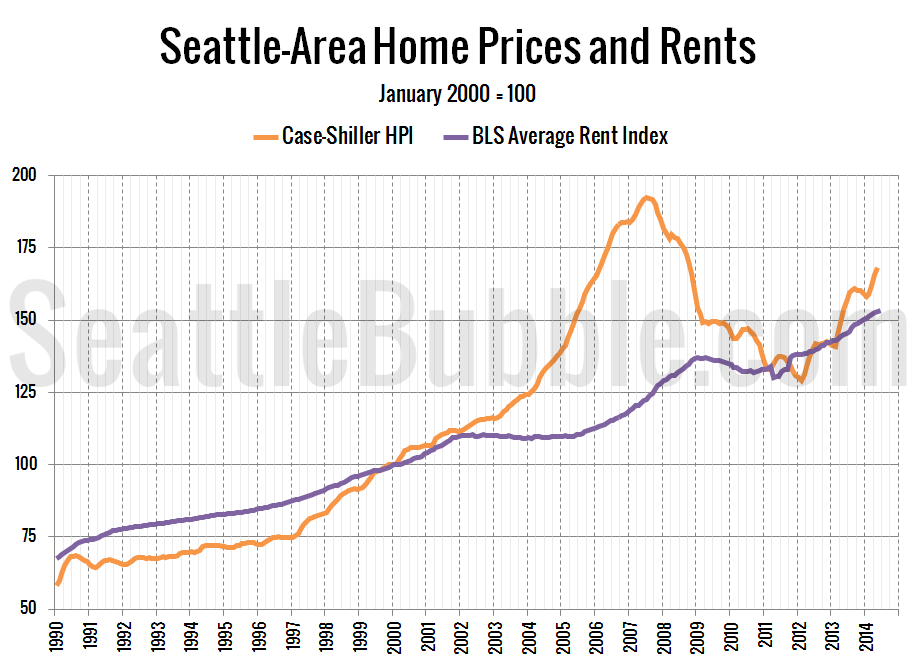
With home prices approaching or even exceeding their 2007 peak levels in parts of the Seattle area, there has been renewed talk about whether we’re in another housing bubble or not. This week I’d like to go back to the same data I used in 2005 and 2006 to definitively recognize the bubble at a…
Share:

  • Twitter
  • LinkedIn
  • Facebook
  • Reddit
  • Pinterest
  • Email

Posts navigation

  • Previous
  • 1
  • …
  • 79
  • 80
  • 81
  • 82
  • 83
  • 84
  • 85
  • …
  • 717
  • Next

Tim’s Other Projects

Dispatches from the Multiverse

Current Market Stats

Charts courtesy Altos Research
Real Estate Market Chart by Altos Research www.altosresearch.com

Real Estate Market Chart by Altos Research www.altosresearch.com

Real Estate Market Chart by Altos Research www.altosresearch.com

Real Estate Market Chart by Altos Research www.altosresearch.com

News Categories

  • News (1,253)
    • Local (223)
    • National (46)
    • International (1)
    • Audio & Video (60)
    • Humor (43)
    • Opinion (88)
    • Uncategorized (314)
  • Features (558)
  • Statistics (1,109)
    • Counties (724)
    • Neighborhoods (100)
  • Economy (74)
  • Extras (491)
    • Polls (381)
    • Flickr Group (1)
    • Announcements (38)
    • Administrative (78)

Archives

Tip Jar

Like what we're doing?

Drop us a tip!

Accounts

  • Log in
  • Entries feed
  • Comments feed
  • WordPress.org
©2024 Seattle Bubble | Built using WordPress and Responsive Blogily theme by Superb