This poll was active 07.20.2014 through 07.26.2014
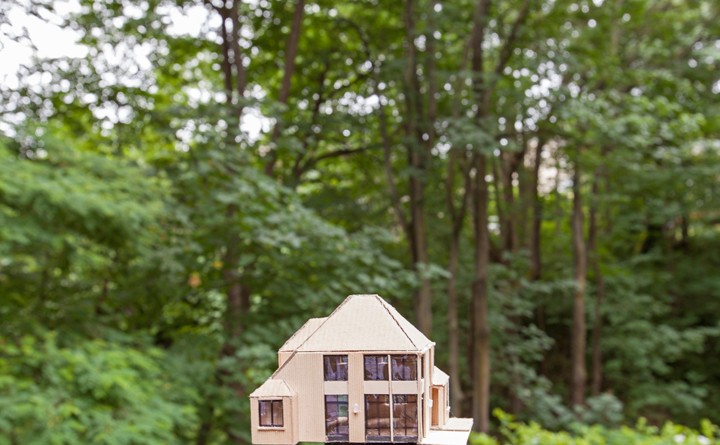
Real Actual Listing Photos: Cardboard Dreams
It’s time once again for another installment of Real Actual Listing Photos. Once a month (or so) I round up some of the most bizarre listing photos from around the Seattle area and post them here, with brief excerpts from the real actual listing description, and probably a bit of snarky commentary. If you want…
Foreclosures Fell Further in June
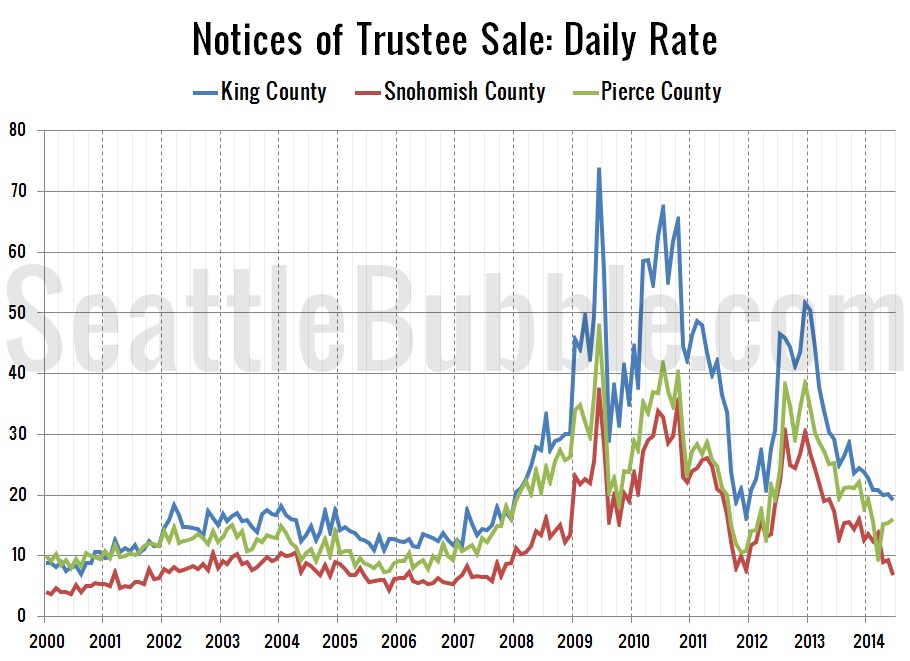
It’s time for our detailed look at June’s foreclosure stats in King, Snohomish, and Pierce counties. First up, the Notice of Trustee Sale summary: June 2013 King: 402 NTS, down 31% YOY Snohomish: 145 NTS, down 58% YOY Pierce: 337 NTS, down 33% YOY The number of trustee sale notices continues to drop dramatically from…
Expensive Neighborhoods See Biggest Price Gains
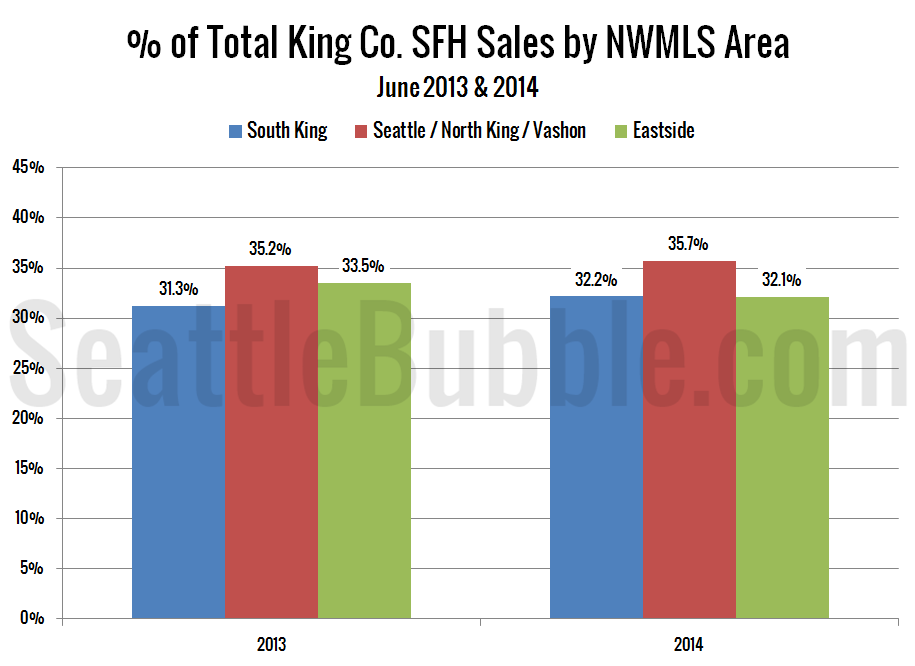
It’s time once again to take an updated look at how King County’s sales are shifting between the different regions around the county, since geographic shifts can and do affect the median price. In order to explore this concept, we break King County down into three regions, based on the NWMLS-defined “areas”: low end: South…
Poll: Do you watch virtual tours for listings?
This poll was active 07.13.2014 through 07.19.2014


