Let’s check out the three price tiers for the Seattle area, as measured by Case-Shiller. Remember, Case-Shiller’s “Seattle” data is based on single-family home repeat sales in King, Pierce, and Snohomish counties. Note that the tiers are determined by sale volume. In other words, 1/3 of all sales fall into each tier. For more details…
Case-Shiller: Seattle Price Gains Cooled Slightly in April
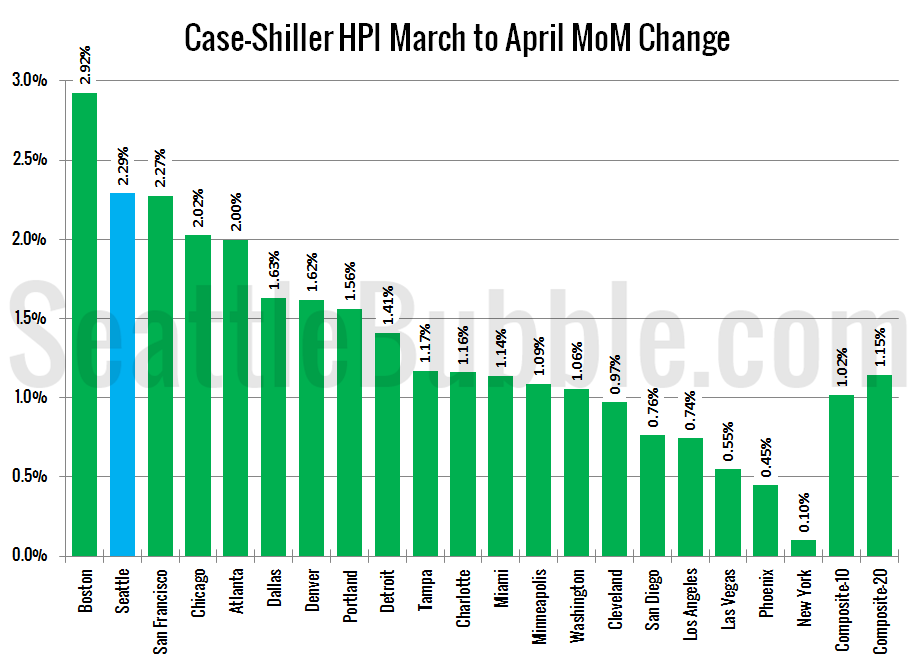
Let’s have a look at the latest data from the Case-Shiller Home Price Index. According to April data, Seattle-area home prices were: Up 2.3% March to April Up 11.2% YOY. Down 13.8% from the July 2007 peak Last year prices rose 2.7% from March to April and year-over-year prices were up 11.4%. Pretty much the…
Poll: Have you or someone you know ever bought or sold a home outside the MLS?
This poll was active 06.22.2014 through 06.28.2014
Affordable Home Price Inched Up in May
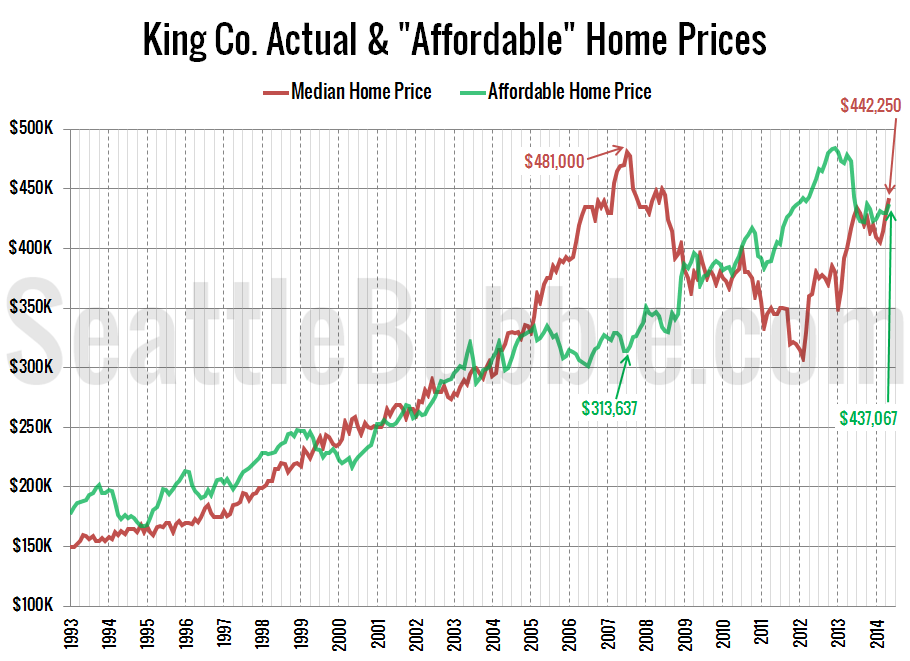
As promised in this morning’s affordability post, here’s an updated look at the “affordable home” price chart. In this graph I flip the variables in the affordability index calculation around to other sides of the equation to calculate what price home the a family earning the median household income could afford to buy at today’s…
Low Rates Keep Seattle Homes Almost Affordable
Let’s take a look at how affordability is doing in the Seattle area after the last couple months of changes in home prices and interest rates. So how does affordability look as of May? Thanks to the spring surge in home prices, we’ve dropped back below the “affordable” level of 100. The index sits at…