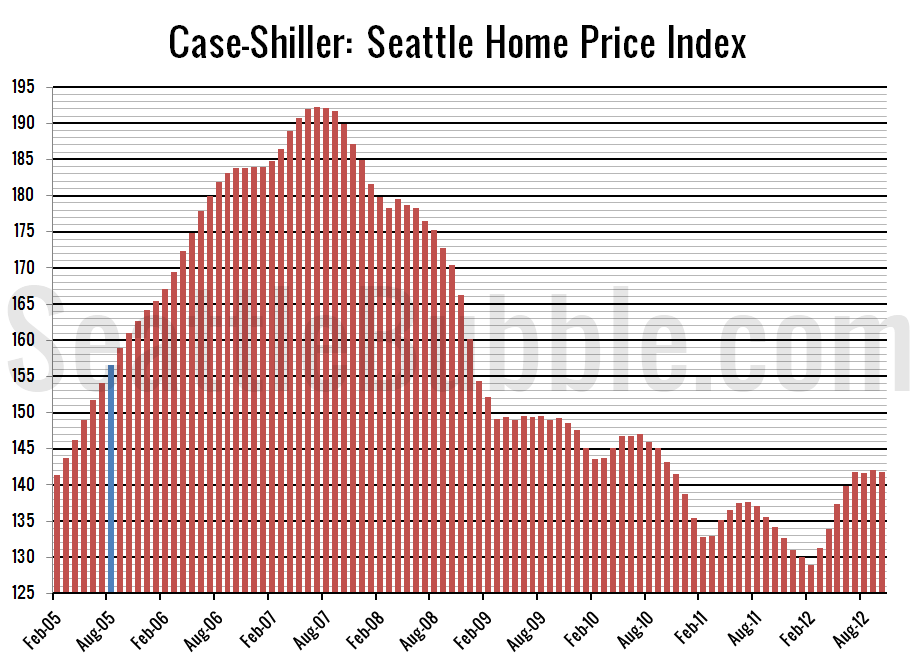
Let’s have a look at the latest data from the Case-Shiller Home Price Index. According to October data, Seattle-area home prices were: Down 0.2% September to October. Up 5.7% YOY. Down 26.3% from the July 2007 peak Last year prices fell 1.0% from September to October and year-over-year prices were down 6.2%. Nothing surprising here….
Tag: graphs
Case-Shiller: Seattle HPI Bucked Seasonality in September
Let’s have a look at the latest data from the Case-Shiller Home Price Index. According to September data, Seattle-area home prices were: Up 0.3% August to September. Up 4.8% YOY. Down 26.1% from the July 2007 peak Last year prices fell 1.1% from August to September and year-over-year prices were down 6.5%. Although Seattle was…
Case-Shiller: Seattle Home Prices Up 3% From 2011
Let’s have a look at the latest data from the Case-Shiller Home Price Index. According to August data, Seattle-area home prices were: Down 0.1% July to August. Up 3.4% YOY. Down 26.3% from the July 2007 peak Last year prices fell 0.3% from July to August and year-over-year prices were down 6.1%. Almost every city…
Case-Shiller: Home Prices Strengthen Into Summer
Let’s have a look at the latest data from the Case-Shiller Home Price Index. According to July data, Seattle-area home prices were: Up 1.4% June to July. Up 3.1% YOY. Down 26.3% from the July 2007 peak Last year prices rose 0.1% from June to July and year-over-year prices were down 6.4%. Another month of…
Case-Shiller: Seattle Home Prices Keep Inching Up
behind the cycle, California, Case-Shiller, graphs, Statistics, Tableau Let’s have a look at the latest data from the Case-Shiller Home Price Index. According to June data, Seattle-area home prices were: Up 1.8% May to June. Up 1.8% YOY. Down 27.3% from the July 2007 peak Last year prices rose 0.7% from May to June and…
