It’s time once again for the monthly reporting roundup, where you can read my wry commentary about the news instead of subjecting yourself to boring rehashes of the NWMLS press release (or in addition to, if that’s what floats your boat). To kick things off, here’s an excerpt from the NWMLS press release: Western Washington…
Tag: NWMLS
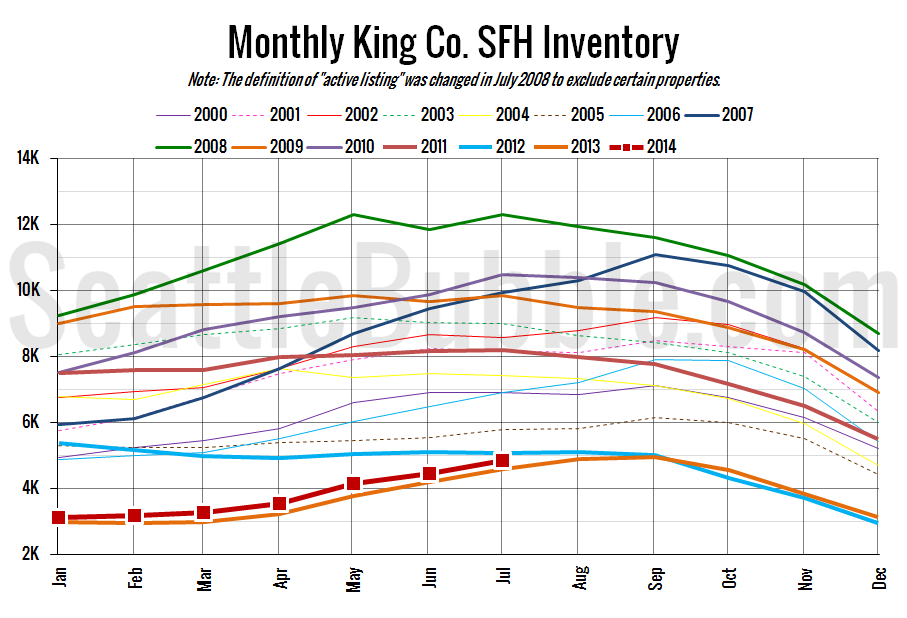
NWMLS: Inventory Inches Up as Home Prices Near Peak
July market stats were published by the NWMLS today. Here’s a snippet from their press release: Western Washington housing market in “recovery mode” but some brokers say it’s still not at full potential. More sellers listed their homes for sale during July compared to a year ago, but brokers with Northwest Multiple Listing Service say…
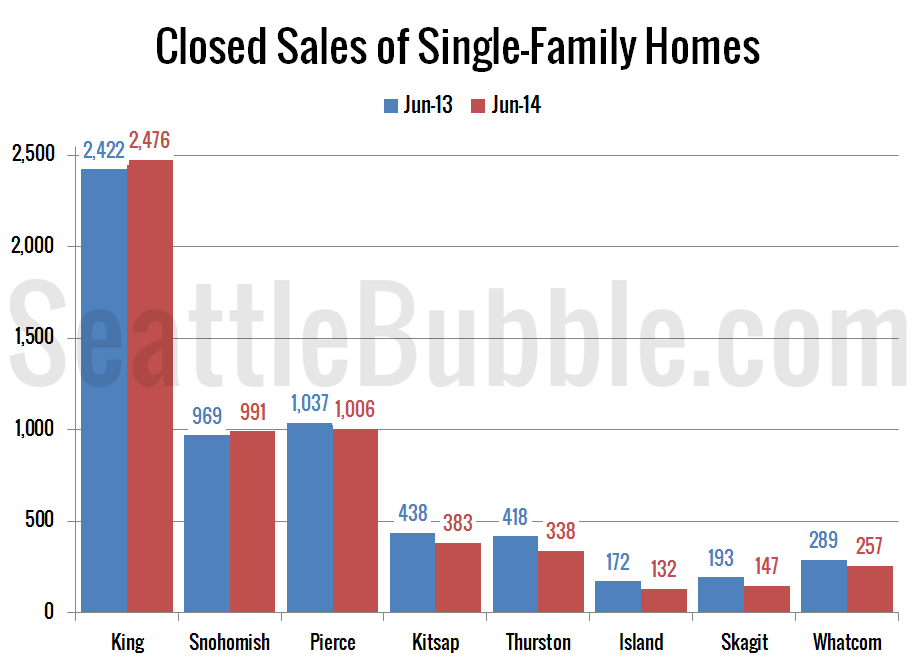
Around the Sound: King & Snohomish Buck Sales Trend
It’s time for us to check up on stats outside of the King/Snohomish core with our “Around the Sound” statistics for Pierce, Kitsap, Thurston, Island, Skagit, and Whatcom counties. If there is certain data you would like to see or ways you would like to see the data presented differently, drop a comment below and…
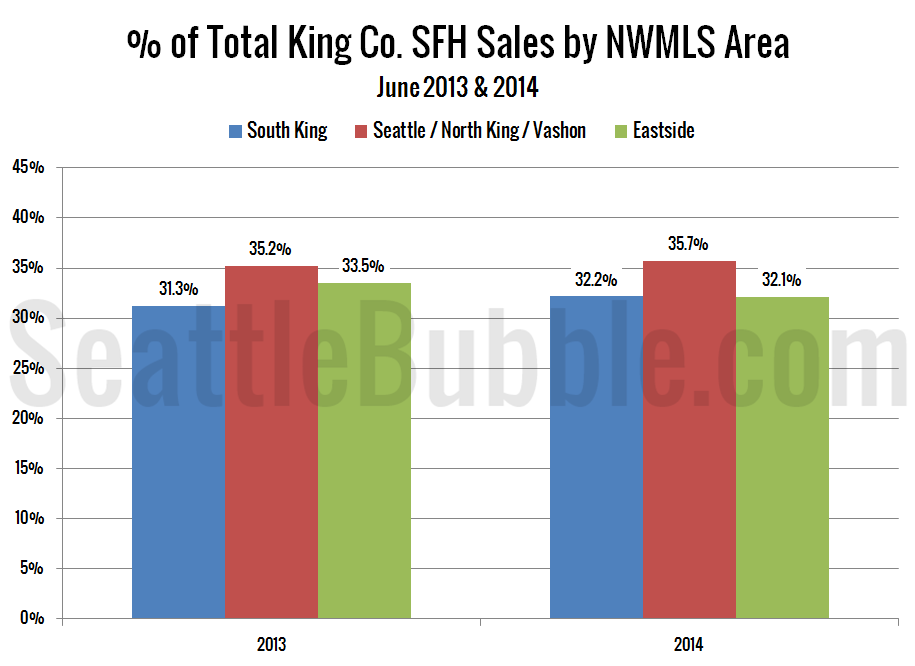
Expensive Neighborhoods See Biggest Price Gains
It’s time once again to take an updated look at how King County’s sales are shifting between the different regions around the county, since geographic shifts can and do affect the median price. In order to explore this concept, we break King County down into three regions, based on the NWMLS-defined “areas”: low end: South…

The New Normal: 25 Percent of Pending Sales Don’t Close
Let’s take a look a the latest data on pending sales volume versus closed sales volume. For this series I roll the pending sales and closed sales data up by quarter, with pending sales offset by one month. In other words, the second quarter numbers below represent pending sales from March, April, and May and…