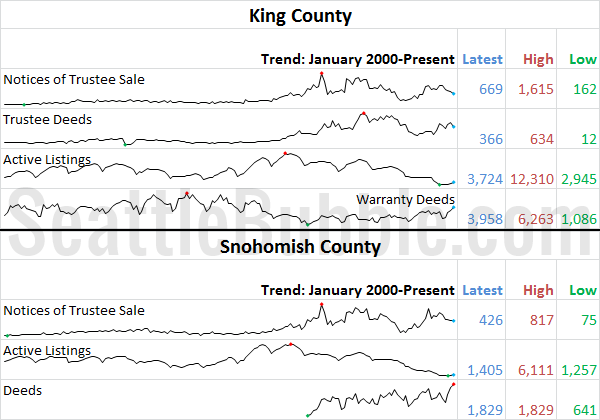
Now that the month of May is behind us, let’s have a look at our stats preview. Most of the charts below are based on broad county-wide data that is available through a simple search of King County and Snohomish County public records. If you have additional stats you’d like to see in the preview,…
Tag: sales
April Stats Preview: Finally Some Inventory Edition
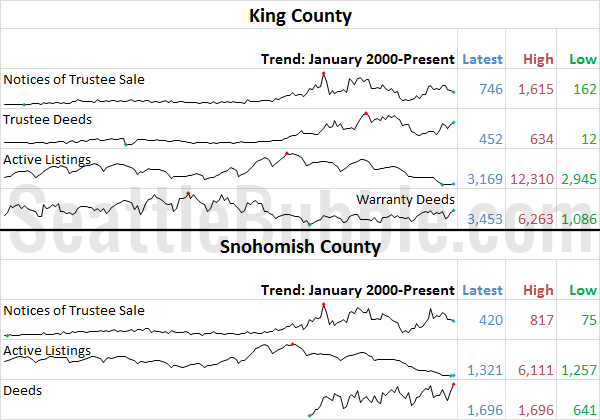
With April 2013 in the history books, let’s have a look at our stats preview. Most of the charts below are based on broad county-wide data that is available through a simple search of King County and Snohomish County public records. If you have additional stats you’d like to see in the preview, drop a…
All Sale Price Tiers Bumped Up in March
Let’s have another look at our monthly sales histogram. Sales across all price tiers got a big boost in March, while the sales curve stayed basically the same shape as February. The mode (i.e. the bucket with the most sales) for non-distressed sales moved from the $400,000 to $450,000 bucket in February down to the…
March Stats Preview: Fewer Foreclosure Notices Edition
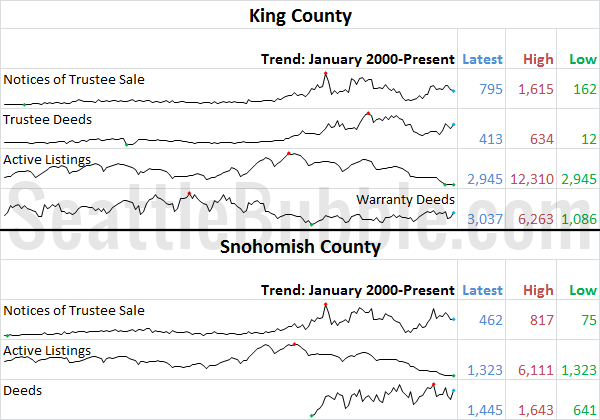
Now that March is done, and April 1 fun is done, let’s have a look at our stats preview. Most of the charts below are based on broad county-wide data that is available through a simple search of King County and Snohomish County public records. If you have additional stats you’d like to see in…
Sales of $200K-$300K Homes Dipped in February
Let’s have another look at our monthly sales histogram. After sharpening in January, the sales curve flattened out again in February, with home sales between $200,000 and $300,000 taking a hit while home sales between $400,000 and $500,000 bumped up. The mode (i.e. the bucket with the most sales) for non-distressed sales moved from the…


