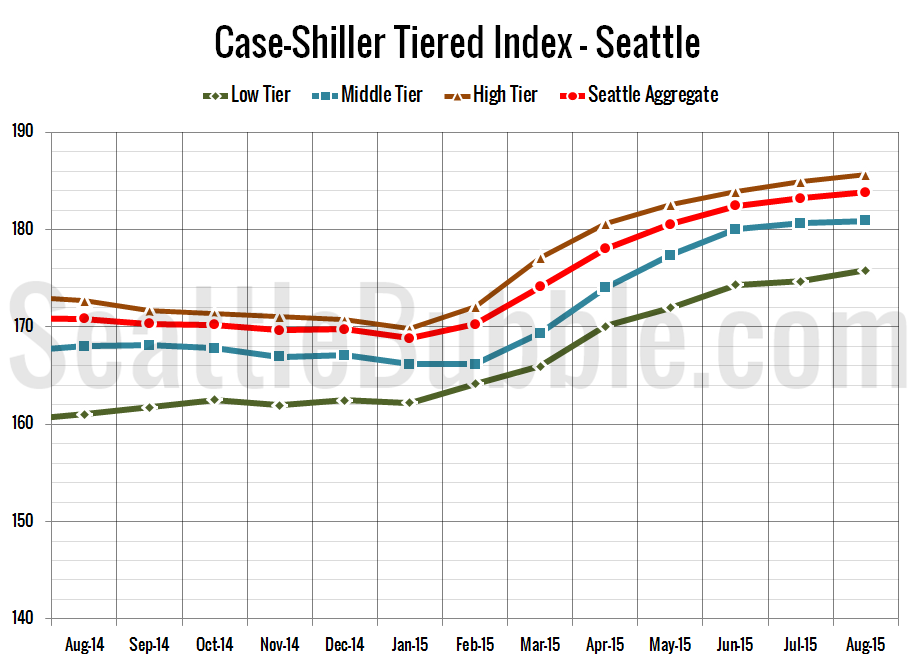
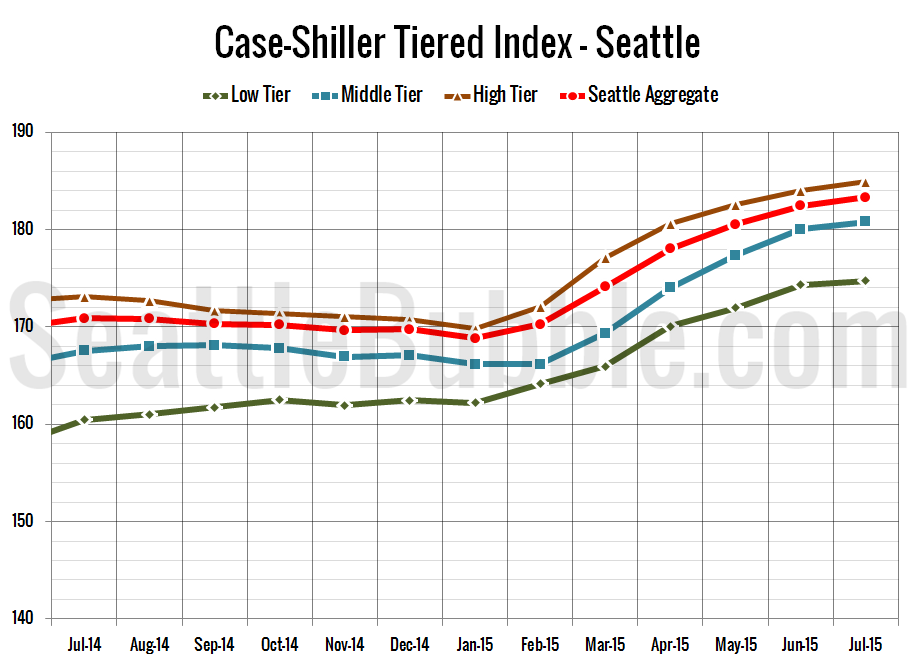
Let’s check out the three price tiers for the Seattle area, as measured by Case-Shiller. Remember, Case-Shiller’s “Seattle” data is based on single-family home repeat sales in King, Pierce, and Snohomish counties. Note that the tiers are determined by sale volume. In other words, 1/3 of all sales fall into each tier. For more details…
Tag: Statistics
Case-Shiller: Prices Gains Slow Slightly in August
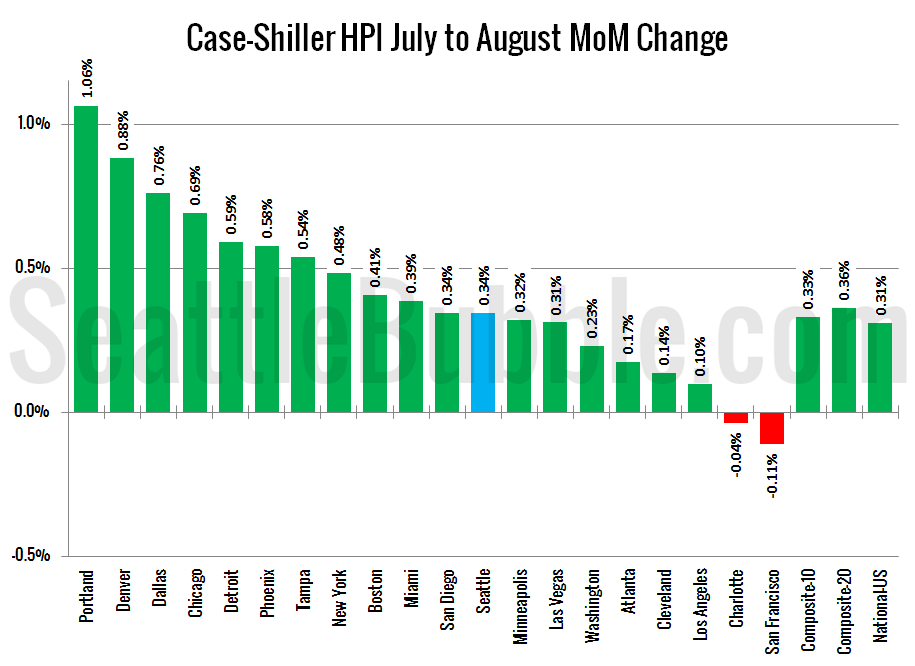
Let’s have a look at the latest data from the Case-Shiller Home Price Index. According to August data that was released today, Seattle-area home prices were: Up 0.3 percent July to August Up 7.6 percent YOY. Down 4.4 percent from the July 2007 peak Last year at this time prices were flat month-over-month and year-over-year…
NWMLS: Historic 2015 Seller’s Market Drags On
September market stats were published by the NWMLS today. Before we get into our monthly stats, here’s a quick look at their press release…
September Stats Preview: Setting Up a Dismal Fall and Winter
Now that September is in the books, let’s have a look at our monthly stats preview.
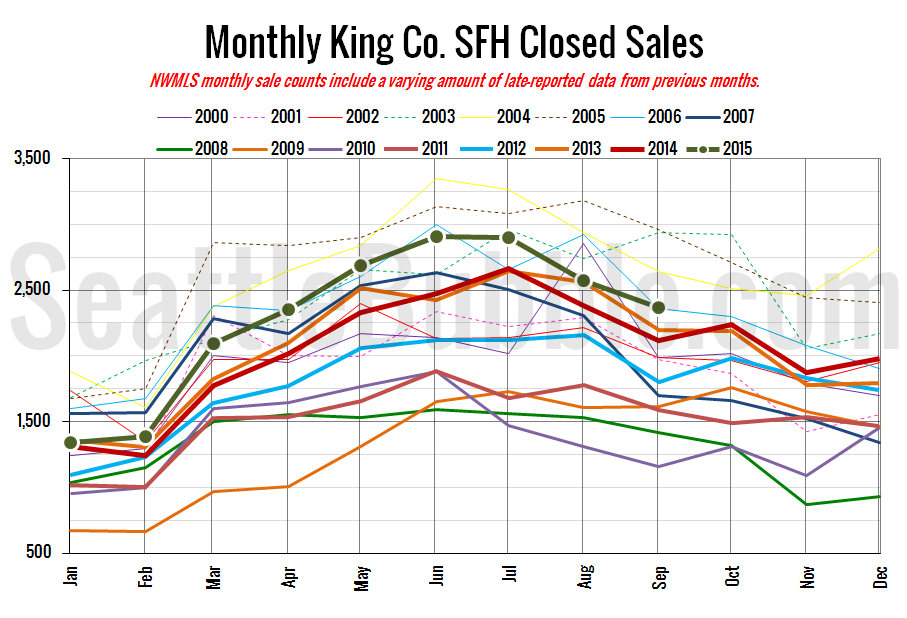
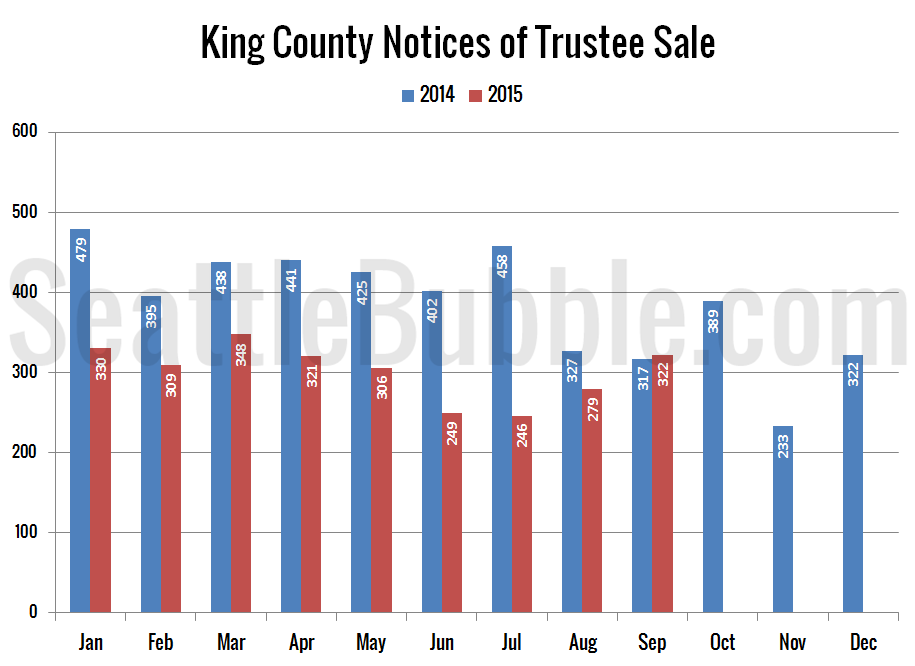
Sales were basically flat month-over-month, but still up double-digits from a year ago, while inventory in both counties saw the biggest year-over-year decline in more than two years. Foreclosure notices in both counties bumped up a little month-over-month and year-over-year…
Case-Shiller Tiers: Price Gains Slowed Slightly in July
Let’s check out the three price tiers for the Seattle area, as measured by Case-Shiller. Remember, Case-Shiller’s “Seattle” data is based on single-family home repeat sales in King, Pierce, and Snohomish counties.
All three tiers were up month-over-month yet again in July. However, the gains in all three tiers were much smaller than they have been for the previous few months…
