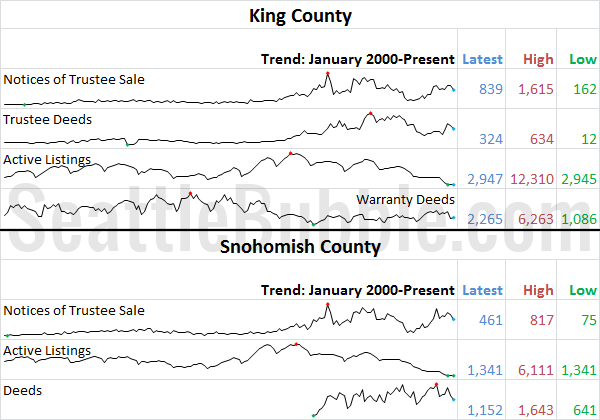
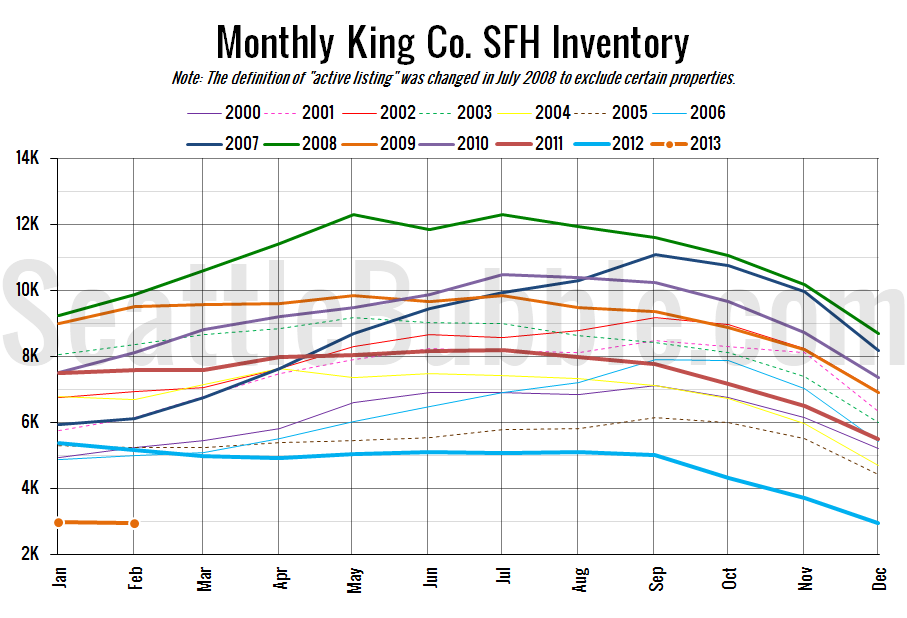
We missed posting this on time at the beginning of the month, but by request, we’re going to have a look at our stats preview. Most of the charts below are based on broad county-wide data that is available through a simple search of King County and Snohomish County public records. If you have additional…
Tag: Statistics
Expensive Eastside Home Sales Spiked in February
Let’s take an updated look at how King County’s sales are shifting between the different regions around the county, since geographic shifts can and do affect the median price. In order to explore this concept, we break King County down into three regions, based on the NWMLS-defined “areas”: low end: South County (areas 100-130 &…
NWMLS: Listings Down Yet Again, Prices Bump Up
February market stats were published by the NWMLS this morning. Here’s a snippet from their press release: Western Washington housing indicators aligned "for spring market to remember". Real estate brokers around Washington state agree today’s market is far different than two years ago, with one industry veteran summing it up by saying key indicators “are…
Case-Shiller Tiers: All Three Tiers Dipped in December
Let’s check out the three price tiers for the Seattle area, as measured by Case-Shiller. Remember, Case-Shiller’s “Seattle” data is based on single-family home repeat sales in King, Pierce, and Snohomish counties. Note that the tiers are determined by sale volume. In other words, 1/3 of all sales fall into each tier. For more details…
Case-Shiller: Seattle Home Prices Dip to Close 2012
Let’s have a look at the latest data from the Case-Shiller Home Price Index. According to November data, Seattle-area home prices were: Down 0.5% November to December Up 8.2% YOY. Down 26.3% from the July 2007 peak Last year prices fell 1.3% from November to December and year-over-year prices were down 5.6%. Nothing surprising in…


