Redfin’s long-awaited IPO went well for the Seattle-based technology-powered real estate brokerage this morning. They priced the IPO at $15 per share last night, raising $138 million for the company. When shares started trading on the open market this morning under the ticker symbol RDFN they opened at $19.56.
Tag: Stock Market
Redfin files S-1, likely to IPO later this year
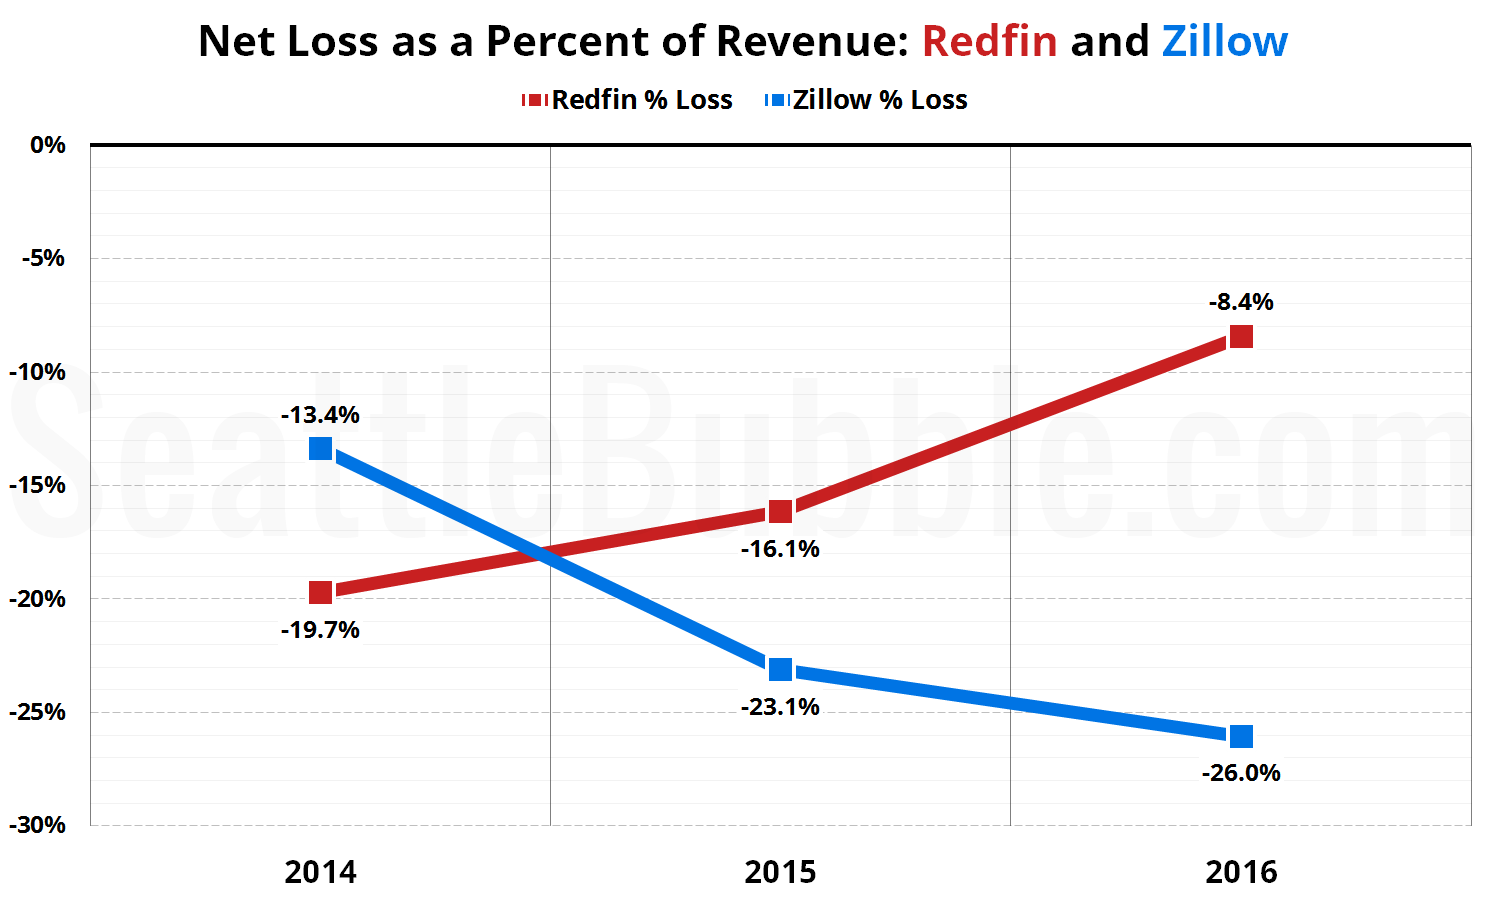
News broke late this afternoon that after 13 years as a “startup,” Redfin has finally filed their S-1 with the SEC, signalling their intent to make an initial public offering (IPO) later this year.
Let’s take this opportunity to directly compare some financial and usage data between Redfin and Zillow.

Will a Prolonged Bear Market Slow Seattle Real Estate?
With stocks being hammered across the world since Friday, the price of oil in the gutter, and volatility through the roof, pundits are starting to get somber about the market’s prospects. If we’re in the beginning of a serious bear market, will Seattle’s crazy real estate market finally start to slow? One of the major…
Poll: Are we currently in a stock market bubble?
This poll was active 09.28.2014 through 10.04.2014
Poll: If I had $1 million to invest, I’d put it in…
This poll was active 01.19.2014 through 01.25.2014